
Point Zero Oscillator Indicator
Point Zero Oscillator indicator is an ideal technical tool for determining trend reversal. It is an incredible detector of market trend reversals.
Description
The point Zero oscillator looks like the MACD indicator. Although they are two different things, they have a lot in common. In fact, the point zero oscillator is similar to the MACD indicator only that it reacts faster to price changes. This means it provides more accurate signals.
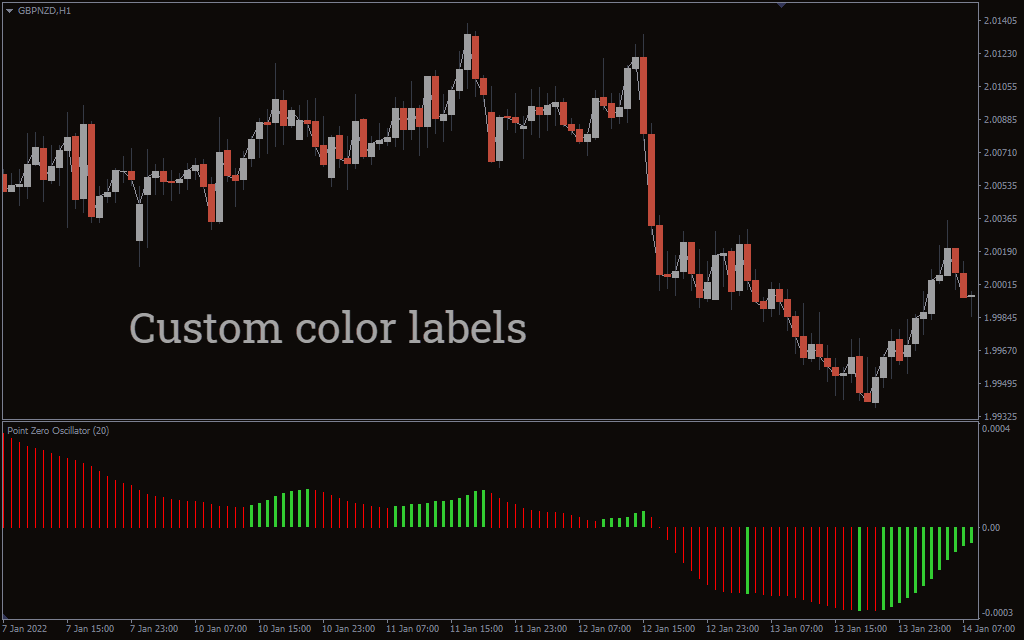
The indicators draw histograms that show the price strength and direction. The colored vertical bars provide buy and sell signals depending on their color. What’s more, the indicator is non-repainting. It works well on any time frame without necessarily fine-tuning the settings. However, the indicator allows you to tweak the parameters settings to optimize your trading.
The point Zero Oscillator works well as a confirmation indicator. For instance, you can use the price action or embed moving averages to indicate the trend direction.
How to Use Point Zero Oscillator Indicator
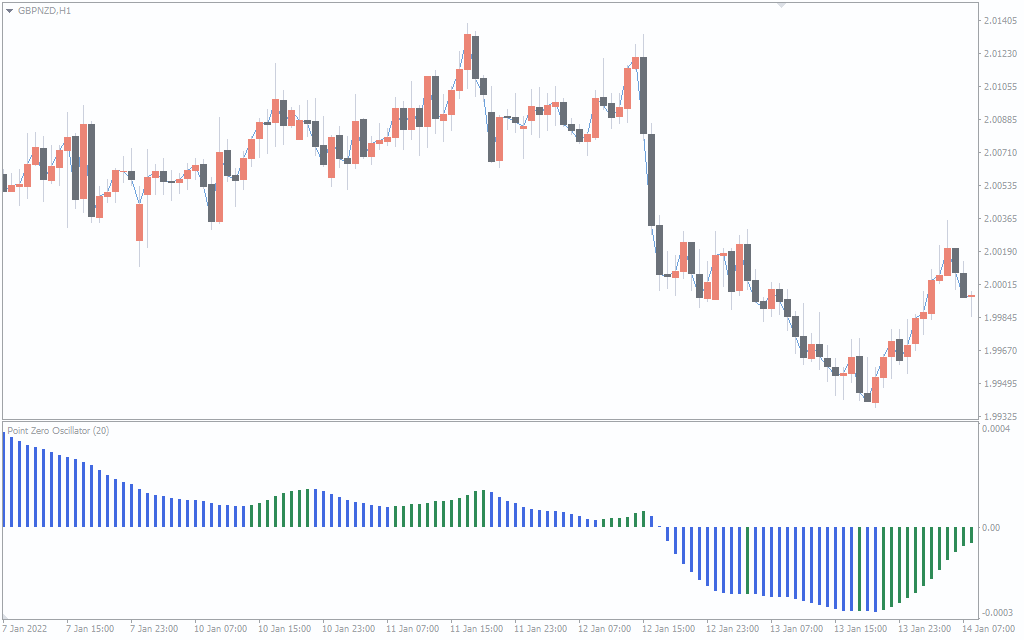
Using the indicator is pretty much straightforward. Point Zero forms blue and red histograms a separate window below the price chart. The bars hang on top and under a zero line.
Buy Signal
The indicator posts a buy signal by drawing blue bars. An ideal signal occurs when the blue bars appear on the top side of the zero line. The length of the bars determines the strength of the momentum. Long bars, therefore, indicate strong market momentum.
Sell Signal
A sell signal occurs when red bars form below the zero line. The bars should be relatively long. In other words, bars near the zero line indicate an indecisive and ranging market.
Exit Strategy
The indicator bars change colors when the trend changes. When the uptrend loses momentum and sellers take control of the market, the bars change from blue to red. The red bars shorten and eventually start elongating after crossing below the zero line. Similarly, a trend reversal from downtrend to uptrend is indicated by a change of color in the bars from red to blue.
Real Market Example
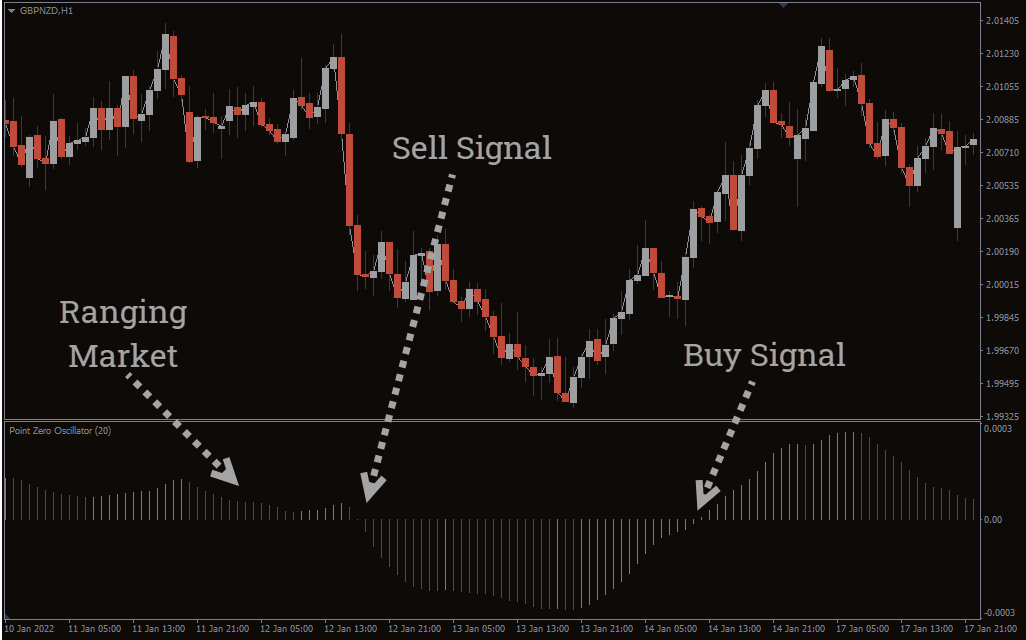
The picture price movement for Great Britain pound against the New Zealand dollar. The market ranges before it starts trending. The ranging market is represented by short bars around the zero line. The indicators post long red bars indicating a strong downtrend.
The downtrend dwindles, and the buyers start to take control of the market. The indicators draw short blue bars which elongate after crossing above the zero line. Once the blue lines start forming above the zero line that is an ideal buy signal.
Conclusion
Point Zero Oscillator is a technical trading tool that shows the market direction and strength of the trend. If you have used the MACD indicator, you will love this one even more. It changes color to blue, alerting you of an uptrend and red to indicate a downtrend. It is a great tool to use for trade confirmations. And you get it free on our website.

1 2 3 4 5