

Pama Ganngrid Indicator
Super easy technical indicator to trade using the classic Gann method. The Pama Ganngrid indicator automatically detects the trend and gives a signal to buy and sell. Non-repaint!
Description
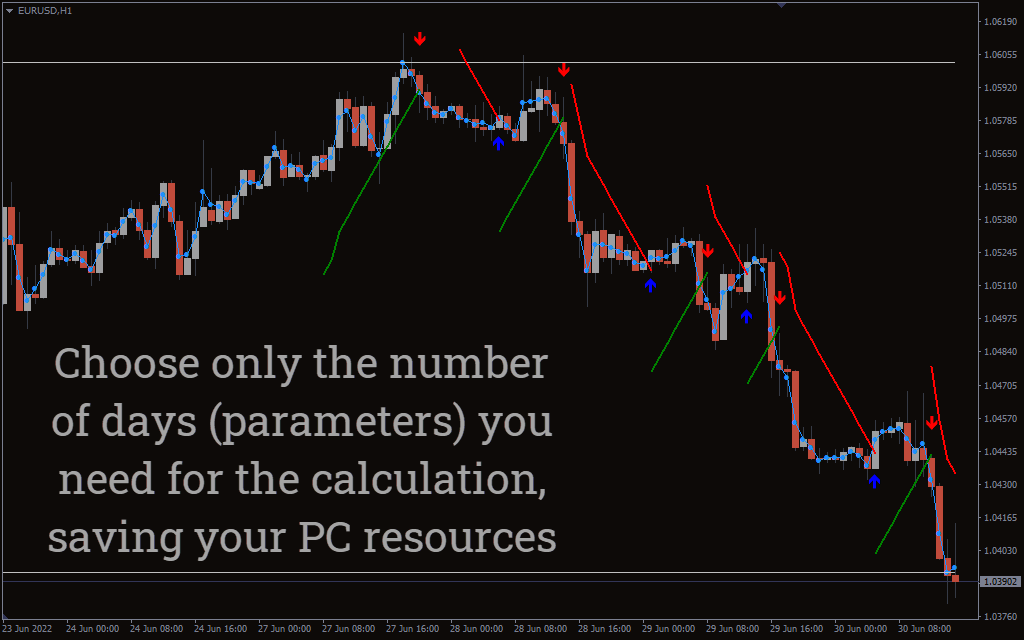
William Gann is a legendary trader of the 20th century, who developed his own grid that have become classics for forex. He used grid to split the price chart into a sequence of bullish and bearish impulses. The Pama Ganngrid Indicator for MT4 does this splitting automatically. Add the indicator to the price chart in MT4 and this is what you will see:

- The blue line over the price bars is the typical price, which is calculated as: (high + low + close) divided by three.
- The levels of resistance and support are built automatically.
- Red and green sloping lines are short-term trendlines.
How to trade using the Pama Ganngrid indicator?
The principle is simple:
- When the blue line crosses the green line from top to bottom, it means the bullish trend is over. The indicator draws a red arrow, automatically giving a sell signal.
- And vice versa. When the blue line crosses the red line from the bottom upwards, it means that the bearish trend is over. In this case, the indicator draws a green arrow, automatically giving a signal to enter the long position.
The chances of making a profit increase if you buy close to the support line and sell close to the resistance line.
The examples below will give more clarity on how to trade using the Pama Ganngrid Indicator.
Example #1. Sell Signal
The EURUSD M30 price chart below represents an example of a short trade.
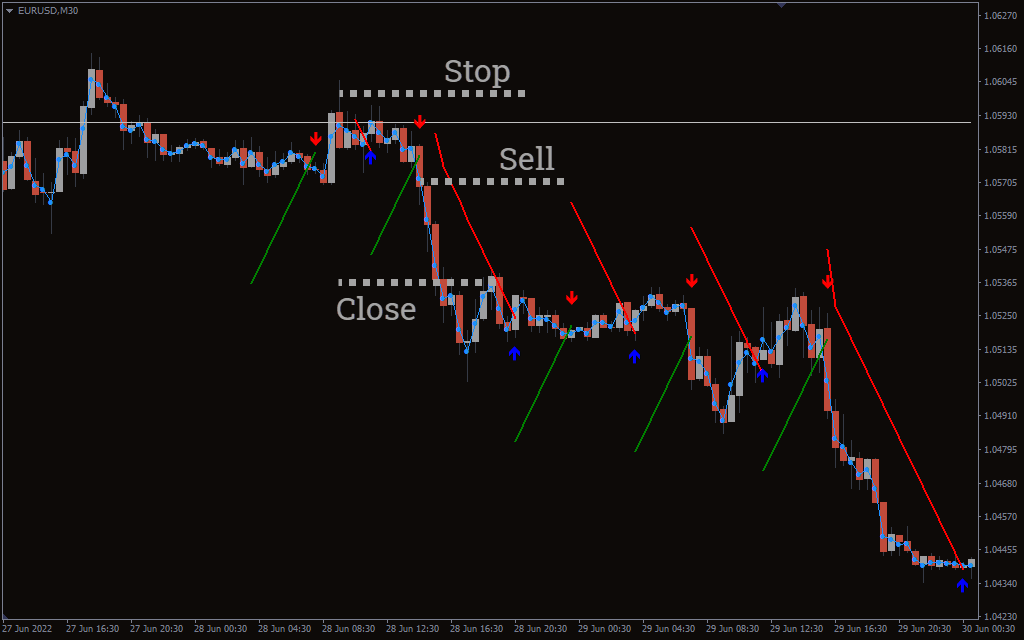
When the red arrow automatically appears near the resistance line, it is a sell signal that opens up promising opportunities. Suppose you open a short position. You set the stop-loss above the previous high, and close the position when the green arrow appears.
Example #2. Buy Signal
The USDJPY daily chart below shows three automatic buy signals.
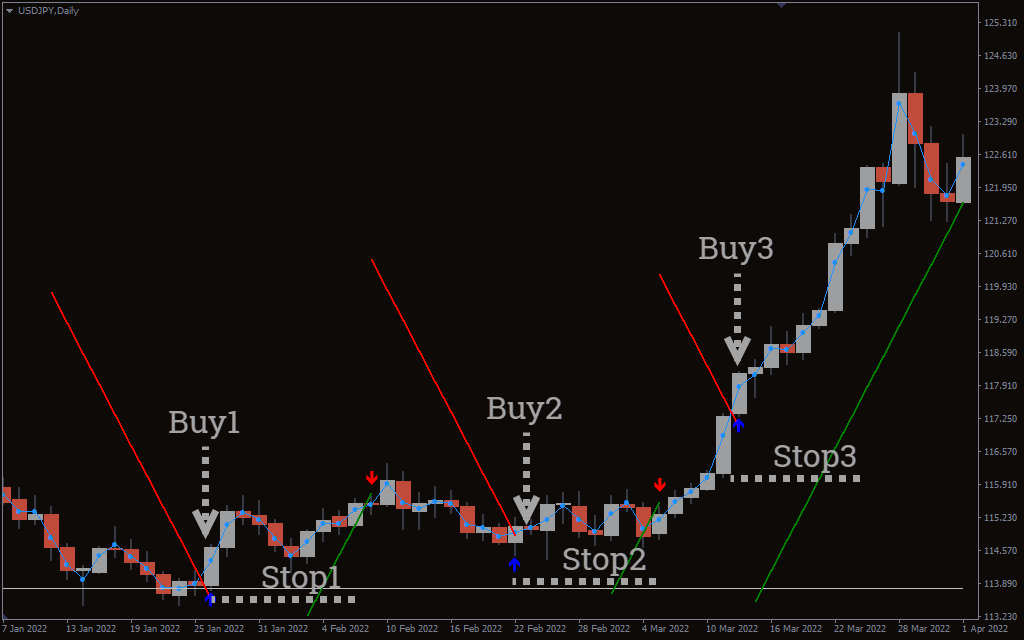
All three buy signals come in when the price is near the support Gann grid line.
Intermediate-term sell signals are an excuse to either reduce the long position or ignore them, as fundamentally the yen was very weak. Japan’s central bank kept ultra-soft monetary policy as inflation in Japan was low, which could not be said about the Fed and USD.
In the first two cases, stop-losses are set below the previous local lows. In the third case, the stop-loss is set below the strong breakout bar.
A counter signal is a reason to close a position. Or take a partial profit, because the bullish trend is very strong.
Conclusion
The Pama Ganngrid Indicator for Metatrader 4 helps you to trade easily with the trend using the classic grid of William Gann.
The indicator builds the grid automatically (it is hidden by default), and gives buy and sell signals by showing arrows on the price chart.
Advantages of the Pama Ganngrid Indicator:
- can be the best indicator for beginner traders, because Pama Ganngrid gives simple and easy to understand signals;
- allows trading forex, crypto, equities and other markets;
- does not repaint;
- the efficiency of signals can be improved by taking into account support and resistance levels;
- can be used by investors on daily and weekly price charts.
Disadvantages:
- doesn’t contain alerts;
- the efficiency of signals significantly decreases when the market is excessively volatile or in a prolonged flat phase.
The Pama Ganngrid Indicator for MТ4 is unlikely to allow you to repeat the brilliant career of William Gann. But thanks to indicator, you won’t miss a single strong trend.
We recommend you to read the classical theory of Gann and to make sure that trading on demo account with this indicator brings you profit. After that, you will be ready to risk real money.
Download the Pama Ganngrid Indicator for MT4 for Free Now!

1 2 3 4 5