
LSMA Indicator
Forex market trends from the best LSMA Indicator for MT4. Find trend direction with the help of Moving Averages.
Description
The LSMA Indicator is a simple MT4 indicator that plots the Moving Average on the chart. The indicator uses the MA calculations as part of its application and works similarly to the traditional MA.
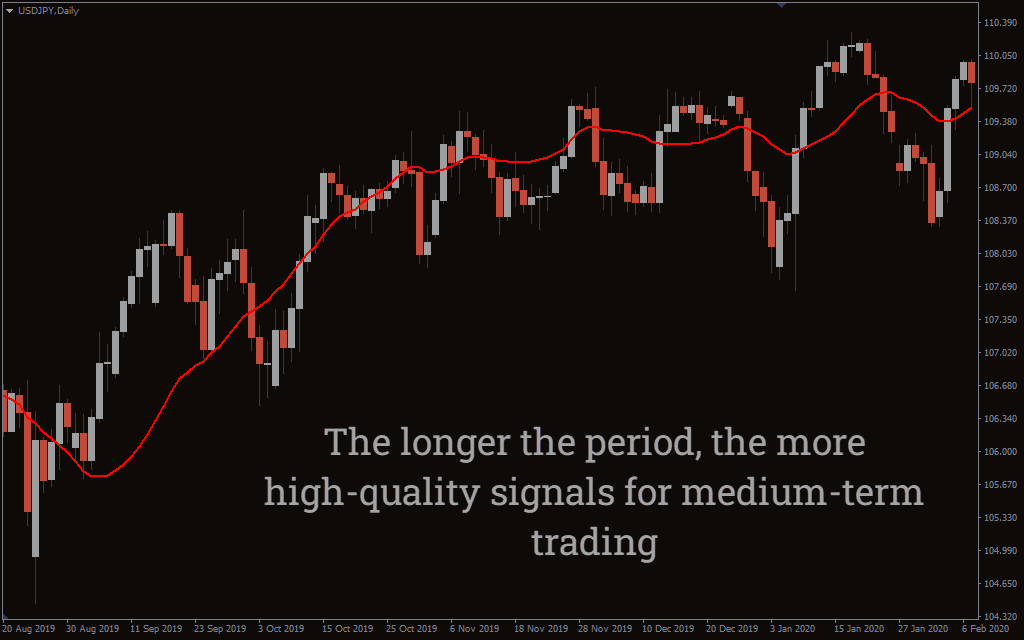
However, the difference between the LSMA and MA is it filters the additional lag which appears on traditional MA. Although you can use the LSMA indicator on all timeframes, the longer the timeframe, the better, as there is a lot of market noise on a shorter timeframe.
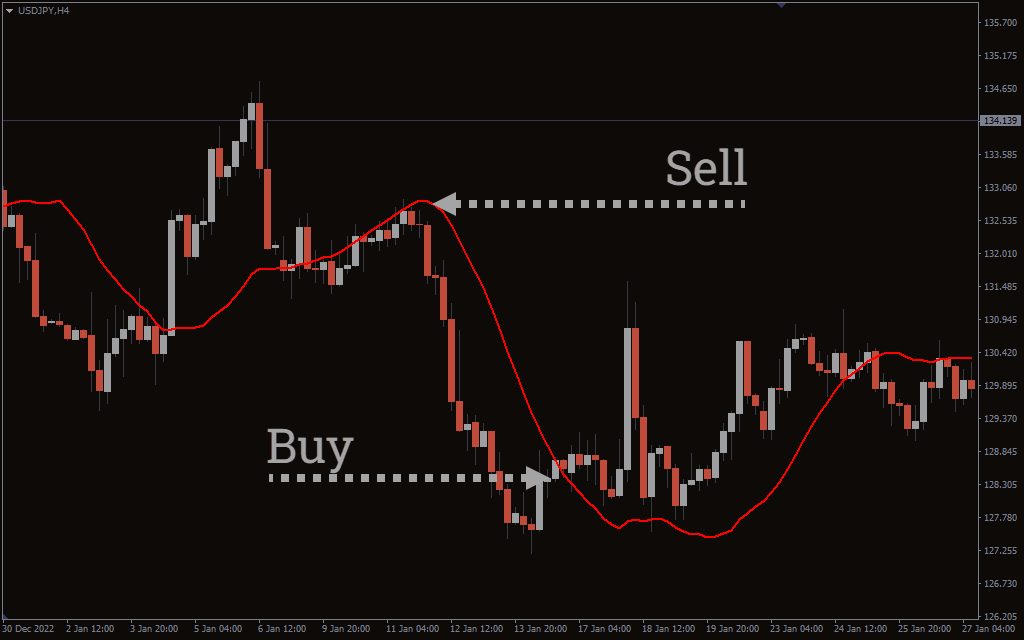
The above USD/JPY H4 chart shows the Indicator’s BUY/SELL signals. LSMA indicator has a simple strategy like the traditional Moving Averages. If the price falls below the indicator, you can take short positions, whereas if the price goes above the indicator, you can go long.
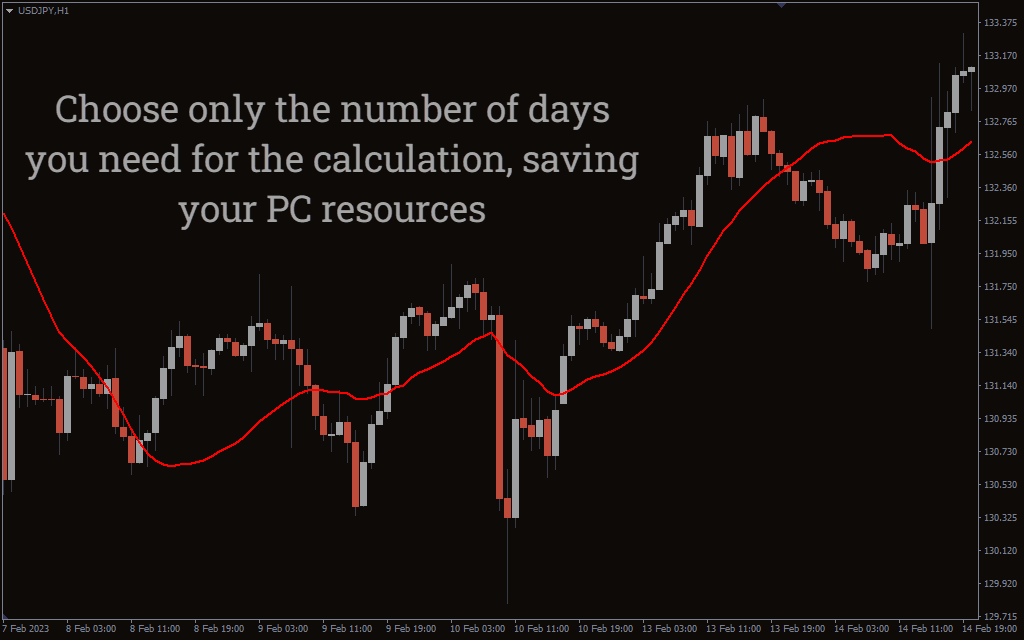
You can also create a Moving Average Crossover strategy with the indicator. To use the strategy, you must apply for another MA of a different period. The default period of indicator is 50, so you can apply shorter or longer period MA.
You can go short if the longer period MA crosses above the indicator. Conversely, if the shorter period MA crosses above the LSMA, you take long positions. Additionally, you can apply other indicators like the MACD or RSI or develop your strategy.
Conclusion
The LSMA Indicator for MT4 applies Moving Average on the chart to find the direction of the trend. You can use the indicator individually or in various strategies. The LSMA Indicator is free to download from our website.

1 2 3 4 5