
Fractal Channel Indicator
Forex market trends from the best Fractal Channel Indicator for MT4. Find overbought and oversold signals within the channel.
Description
The Fractal Channel Indicator is a simple MT4 indicator that draws channel on the chart. The indicator draws three lines; upper, middle, and a lower line to signify a channel.
The upper line mentions the overbought level, while the lower line illustrate an oversold levels. The middle line is a neutral line and the further the line is from the price, the stronger the momentum.
The good thing is you can use the Fractal Channel Indicator on any timeframe. However, applying the indicator on longer timeframes is best to avoid market noise.
How to Use the Fractal Channel Indicator for MT4?
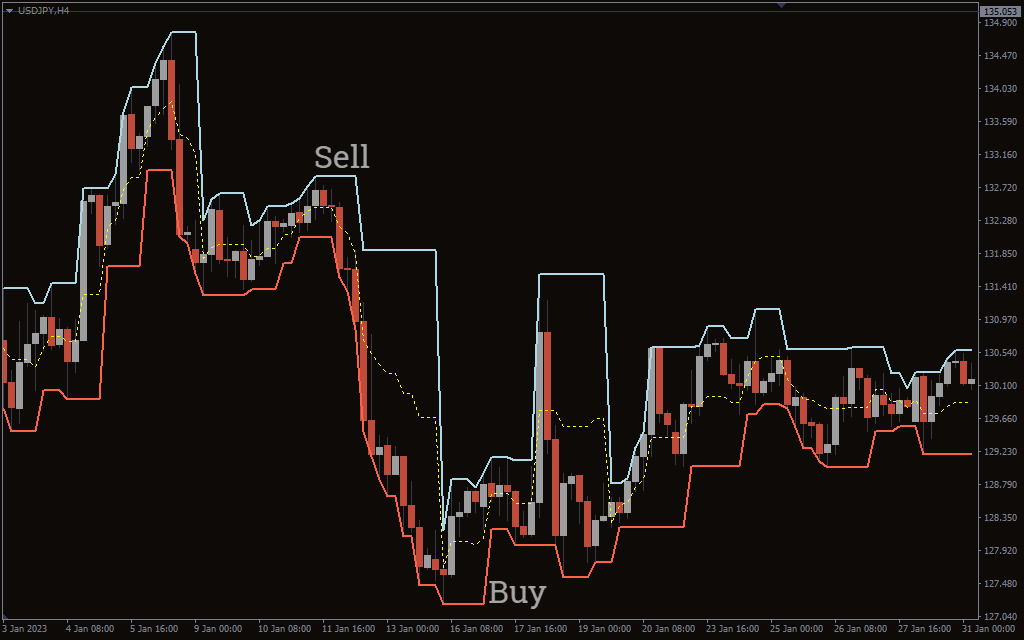
The above USD/JPY H4 chart shows the Fractal Channel Indicator BUY and SELL signals.
To determine BUY/SELL signals, you have to look at the upper and the lower line. When the price touches the upper line, it suggests the upward momentum has faltered and we can expect a bearish reversal.
Conversely, when the price touches the lower line, it tells the downward momentum has faded and we can anticipate a bullish reversal.
It’s important to note that the distance between the price and the middle line suggests how strong the momentum is and you should be looking to take positions when there is a strong momentum.
It’s better to combine this indicator with other indicators like the MACD or the RSI for further signal confirmation.
Conclusion
The Fractal Channel Indicator for MT4 plots three lines to create a channel on the chart. The price moves between the channel and identify bullish and bearish reversal.
If you want to try the Fractal Channel Indicator, you can download the indicator for free on our website.

1 2 3 4 5