
Fibonacci Grid Indicator
Discover precise price action zones with the Fibonacci Grid Indicator for MetaTrader 4 by LuxAlgo. Ideal for trend mapping and retracement forecasting.
Description
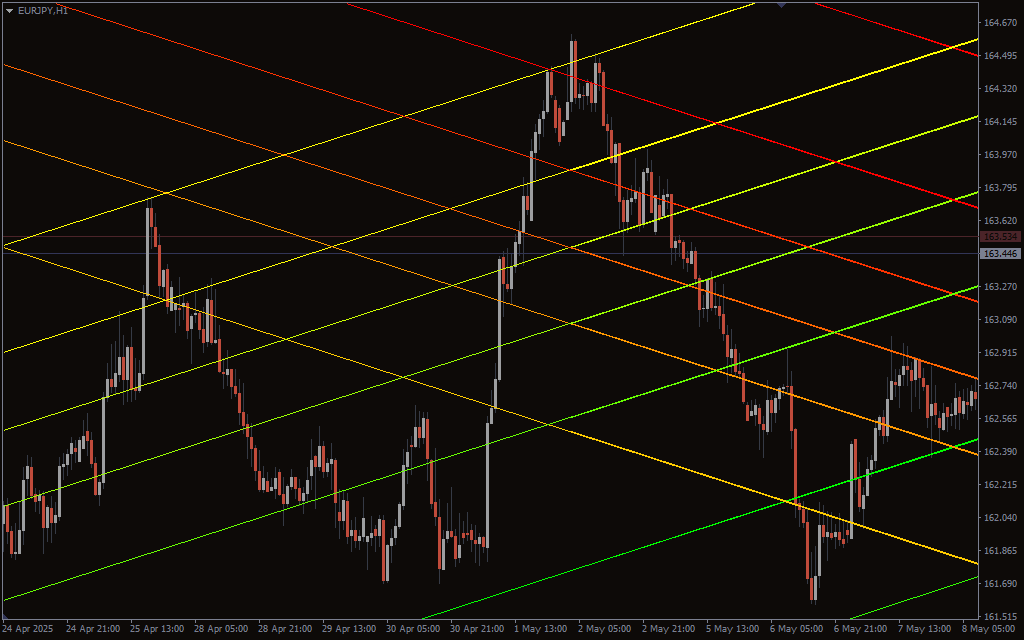
The Fibonacci Grid Indicator for MT4 by LuxAlgo is a powerful visual tool that overlays an automatic channel grid based on Fibonacci ratios across the chart. This tool is especially valuable for traders who follow price action, trend continuation, or reversal strategies. By dividing historical price ranges using mathematical relationships, it maps projected channels across the chart—making it easier to anticipate support, resistance, and trend bias across multiple timeframes.
This indicator eliminates the need for manual plotting of Fibonacci levels and diagonal channels, allowing traders to see structured trend zones with enhanced clarity. It works effectively on all symbols and is best used in trending or consolidating markets where price respects horizontal or sloped ranges.
Fibonacci Grid Indicator Trading Signals
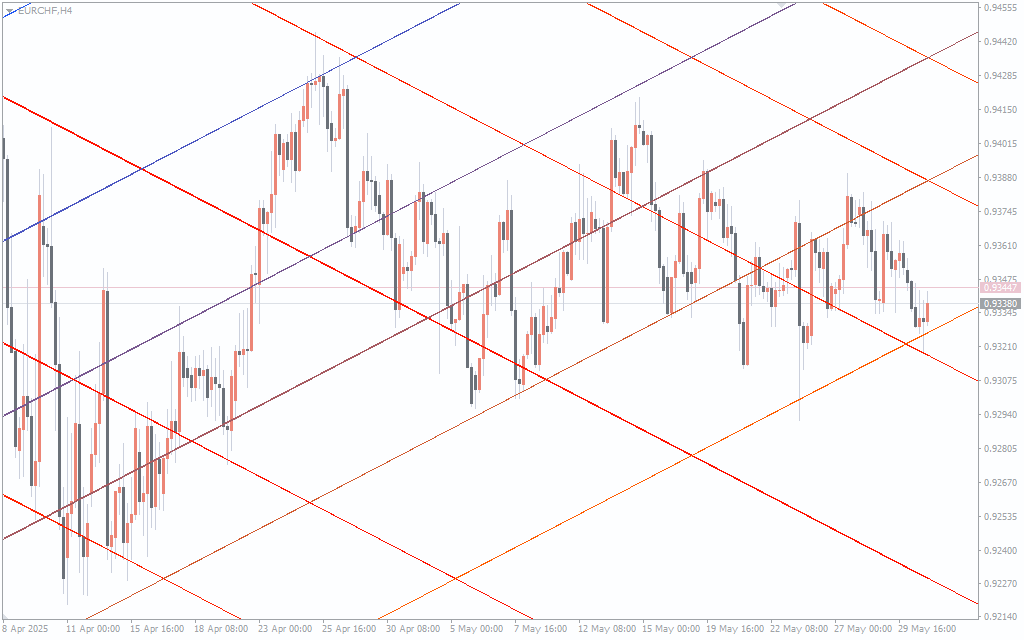
The indicator doesn’t provide buy or sell arrows but delivers trading signals visually through structured grids aligned with Fibonacci ratios. Price movement within these grid levels helps identify high-probability zones where price may reverse, consolidate, or break out. When price respects the upper or lower sloped lines repeatedly, it signals a strong trend channel. Reactions at mid-levels hint at potential pullbacks or corrective waves. This structure allows traders to refine entry and exit timing by following price behavior in relation to Fibonacci-defined zones. The grid becomes particularly valuable when price approaches the extremes of the structure, signaling either trend exhaustion or breakout readiness.
Conclusion
The Fibonacci Grid Indicator by LuxAlgo is a highly visual forecasting tool designed for traders who rely on structure and price geometry. By combining Fibonacci mathematics with dynamic grids, it gives traders a contextual framework for mapping support, resistance, trend channels, and reversal zones. It’s particularly helpful for anticipating breakout targets and managing pullback entries with precision. Whether you trade short-term or long-term, this tool adds depth and clarity to your market view.

1 2 3 4 5