
Extreme RSI Indicator
Forex market trend from the best Extreme RSI Indicator for MT4. Find the trend’s strength with the help of arrows.
Description
The Extreme RSI Indicator is an upgraded version of the traditional RSI indicator and plots arrows to signal the trend’s direction. It uses the standard RSI calculations and plots blue arrows. These arrows appear whenever there is a strong trend.
The good thing is indicator works on all timeframes. However, to avoid any false signals, applying the indicator on longer timeframes is better.
How to use the Extreme RSI Indicator for MT4?
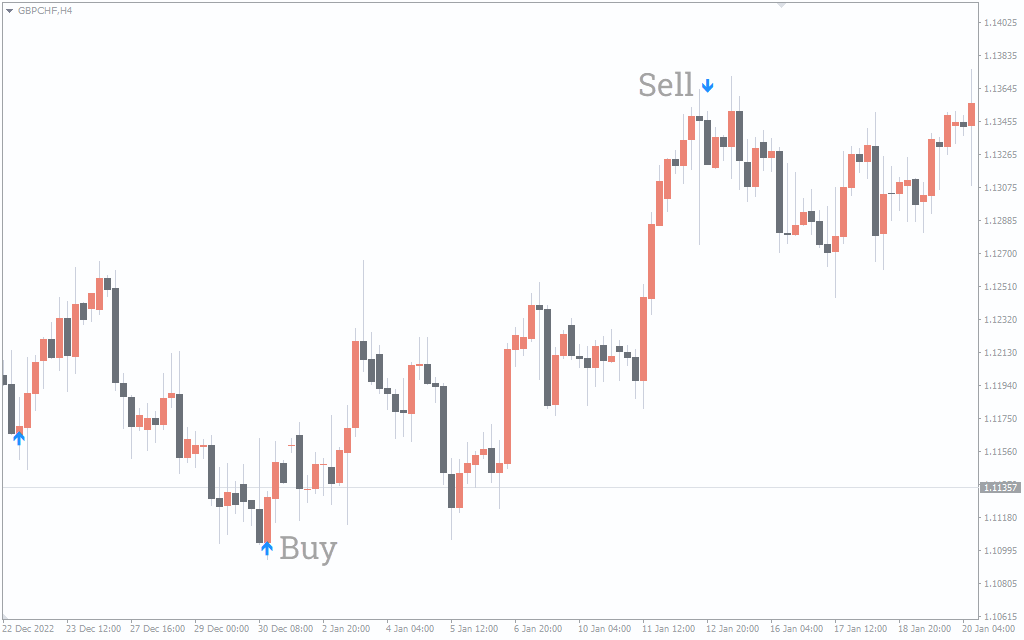
The above GBP/CHF H4 chart shows the Extreme RSI Indicator BUY/SELL signals.
Whenever there is a strong trend, the indicator plots an arrow. The indicator plots the blue arrow on the bullish bar if there is a strong uptrend. Conversely, the indicator draws the blue arrow on the bearish bar if there is a strong downtrend.
The indicator doesn’t signal the overbought/oversold levels like the traditional RSI, but it is a non-repainting indicator. This means that it doesn’t repaint after drawing an arrow.
It can also draw multiple arrows during a strong trend. This signifies the trend’s continuation, and you can take position accordingly.
It’s important to remember that the indicator can plot arrows at random. So, it’s best to combine others indicators with this Indicator for further signal confirmation.
Conclusion
The Extreme RSI Indicator for MT4 modifies the traditional RSI and plots the blue arrows when there is a strong trend. By looking at the arrows, you can determine entry and exit points.
You can download free this indicator from our website.

1 2 3 4 5