
Custom Moving Average Indicator
Custom Moving Average for MT5 is a super trend indicator that helps you identify trend reversals and solid price breakout levels. Classic forex and stock trading tool
Description
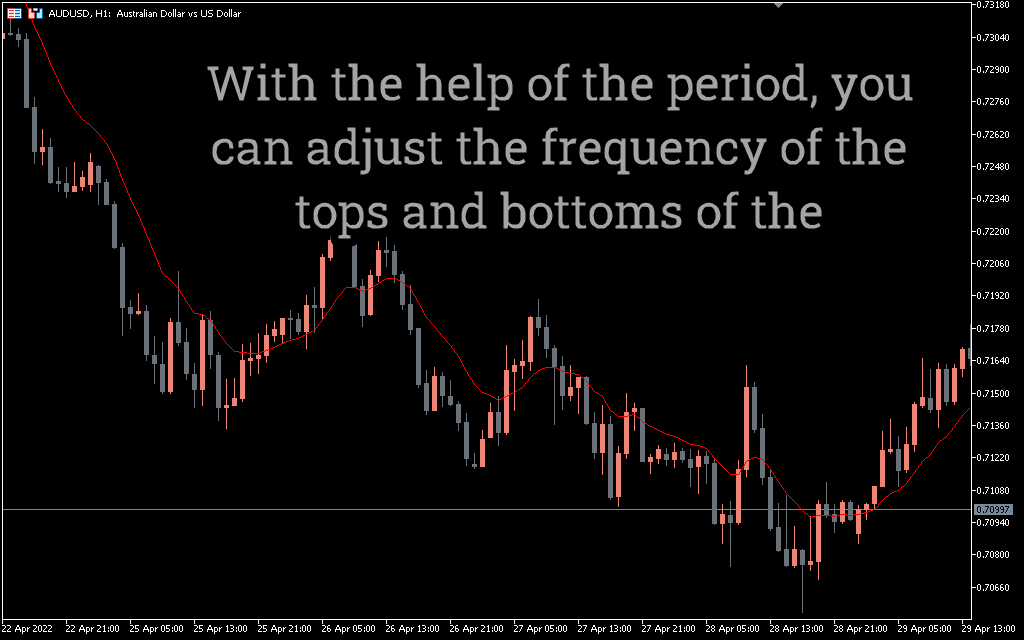
The Custom Moving Average indicator smooths out market fluctuations by applying a characteristic average price value. This tool allows you to compare the difference between the current price and its average value to determine trend conditions.
Like any trend indicator, the moving average helps to anticipate the upcoming direction and possible destination of the price. However, this classic technical tool is different from the usual exponential and simple moving averages in the market.
The SMA has a lagging problem that makes most day traders prefer the EMA because it reacts so much faster than a simple one. So, the developer of this indicator planned to create an advanced moving average suitable for all trading styles and applicable to MTF charts.
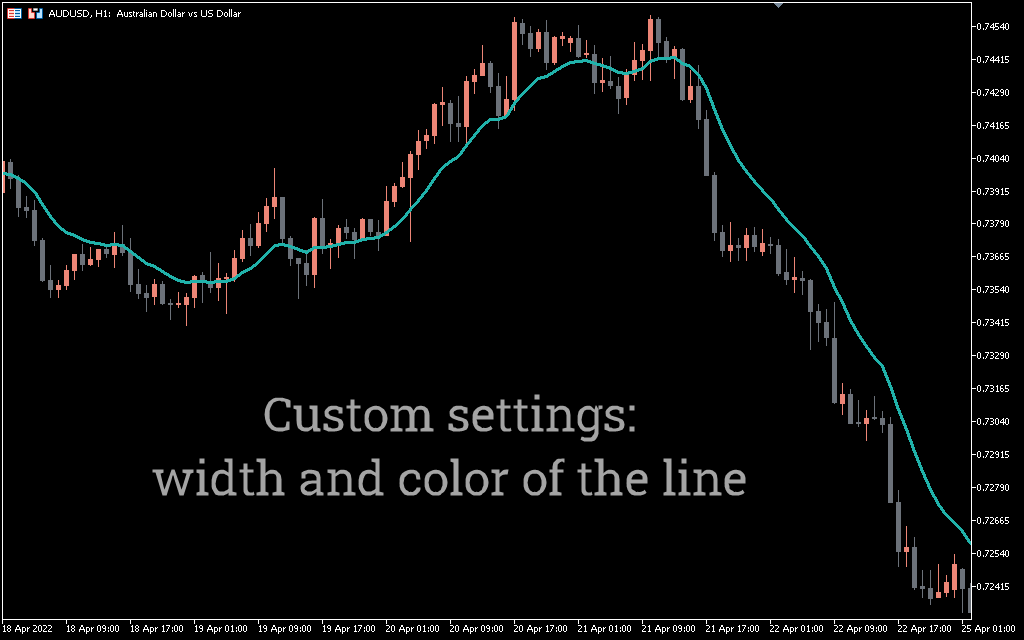
In addition, the Custom Moving Average indicator is highly customizable. So you can customize it yourself whenever needed. However, its default settings work for all currency pairs and forex stocks.
This guide explains how to use the moving average indicator for profitable Forex and stock trading in MT5.
How to determine forex buy-sell signals by using the Custom Moving Average indicator?
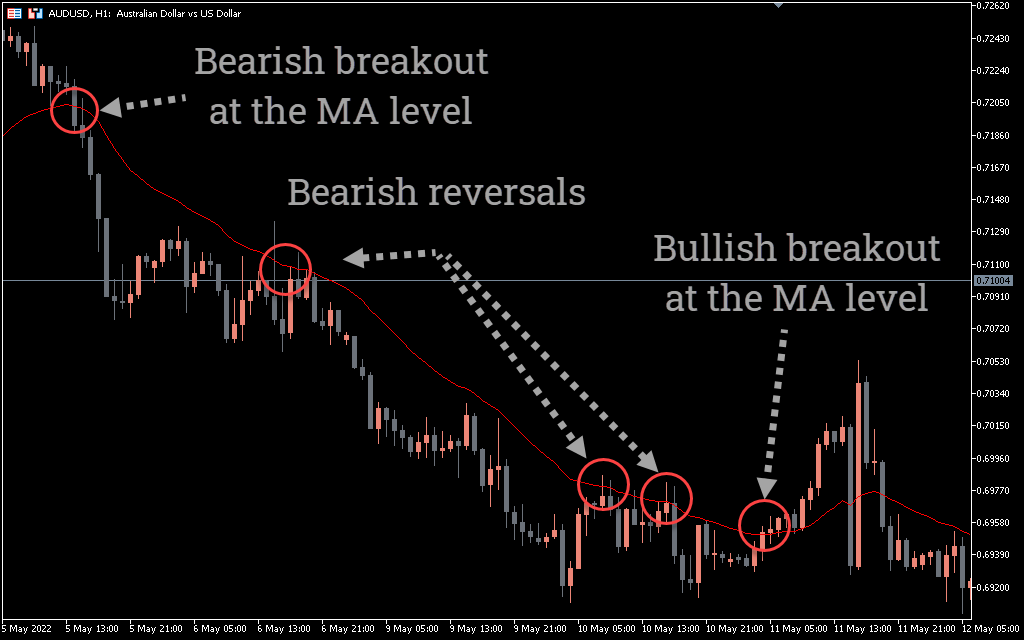
As in the image above, the MA line gives you a general idea of the direction of the market trend. Here you only need to evaluate if the price is going to stay above or below the indicator level.
We consider a bullish trend signal when the price rises above its current moving average. Usually the price stays above the level of the indicator during a bullish trend.
The example above shows how price reacts to a moving average line during a bullish trend. After the price made a bullish breakout at the trendline, it continued to bounce higher each time it hit a slope. Thus, during a bullish move, the best ideal to go long is to wait for the price to return to the MA line. Because in such conditions, price rejecting trendline support means that the market is about to return to its current bullish rally.
During a bearish trend, the price stays below the moving average line. If you are planning to enter a short position after a downtrend in the market, make sure that the price returns to the indicator line and considers this level as resistance.
Conclusion
With its ease of use and clear display of trend signals, the moving average has already become one of the most popular trend indicators in the currency and stock markets. In addition to trend signals, it also helps identify intraday price breakout levels and dynamic support/resistance zones. So, if you are looking for a simple yet versatile trend indicator, a custom moving average is worth a try.
1 2 3 4 5