

Better Bollinger Band Indicator
The best market volatility indicator for identifying intraday BUY/SELL signals in MT5. Indicates overbought/oversold price positions. Compatible with MTF charts.
Description
Better Bollinger Band is a trend-following Forex and stock trading indicator that helps traders pinpoint buy/sell zones. Unlike conventional Bollinger Bands, this indicator clearly shows dynamic trendlines near overbought/oversold levels.
Technically, the indicator indicates both a trend continuation and a reversal. These features allow traders to follow the trend and swing trading at the same time.
In addition, extended Bollinger Bands are also suitable for futures, metals, energy and cryptocurrencies trading besides forex and stocks. Hence, this indicator allows you to trade any financial assets available on your Metatrader 5 platform.
This guide explains the most effective technique for identifying buy/sell signals using the Better Bollinger Band indicator in MT5, including sample charts.
How to trade using the Better Bollinger Band Indicator in MT5
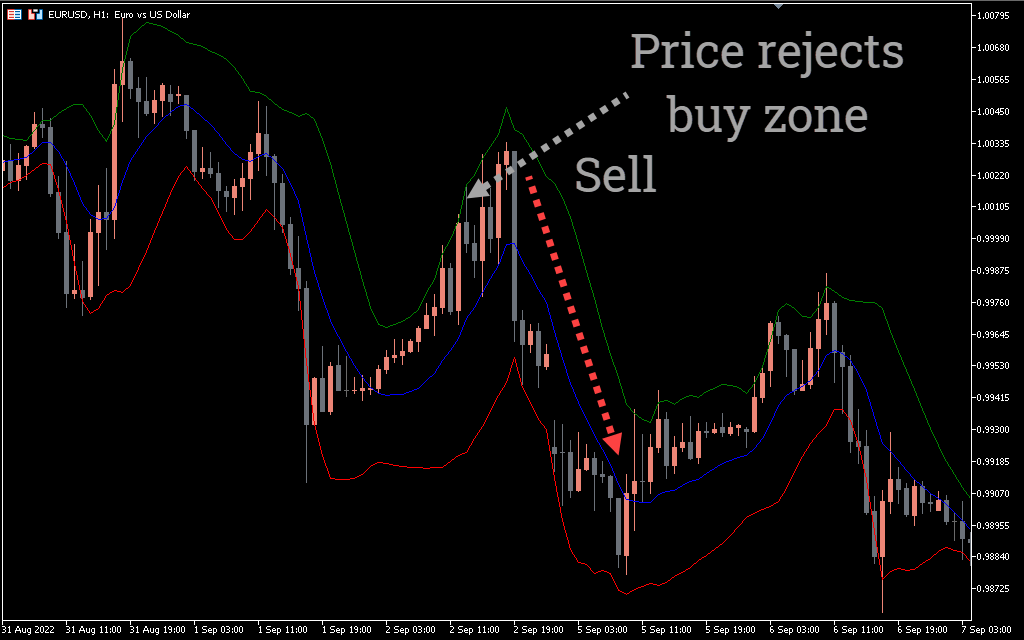
When looking for a trend entry, we need to assess the price intention to stay in the green or red area of the Bollinger Bands.
As you can see from the example above, the price initially held in the red zone, indicating a downtrend in the market. However, the price entered the buy zone, but was rejected by the sellers from the higher Bollinger bands. Later, the price breaks the middle band and triggers a sell entry, suggesting that the market will join the recent bearish rally.
We will use the higher Bollinger Band as a stop loss when going short. In addition, we will hold our sell positions until the price breaks the middle band. alternatively, you can exit the trade manually if the trade already meets your target risk/reward ratio.
When entering a long position, consider a bullish breakout of the middle band during an uptrend in the market. Set a stop loss below the lower Bollinger Band and stay long until the price enters the sell zone.
Conclusion
Enhanced Bollinger Bands offer a simple display of market trend status that is easy to read and follow. In addition to identifying market momentum and trend conditions, it also helps measure price volatility levels. In addition, it identifies potential stop loss and take profit areas and predicts exact buy/sell positions.
1 2 3 4 5