Xmaster Formula Indicator
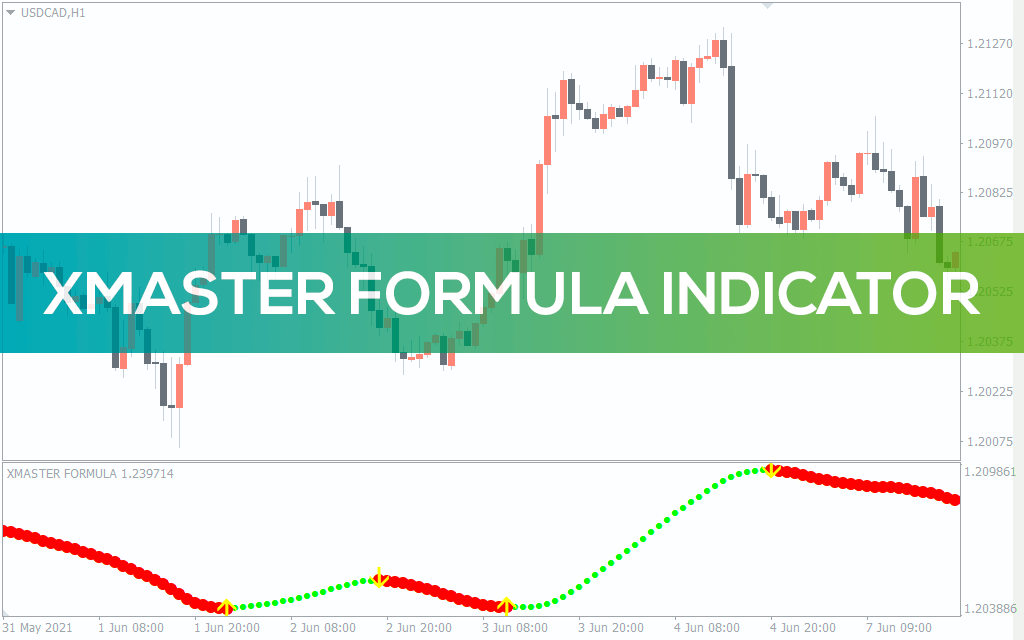
Xmaster Formula Indicator for MT4 best forex technical trading strategy. Shows BUY and SELL arrow trading signals and trend directions. Free to Download
Description
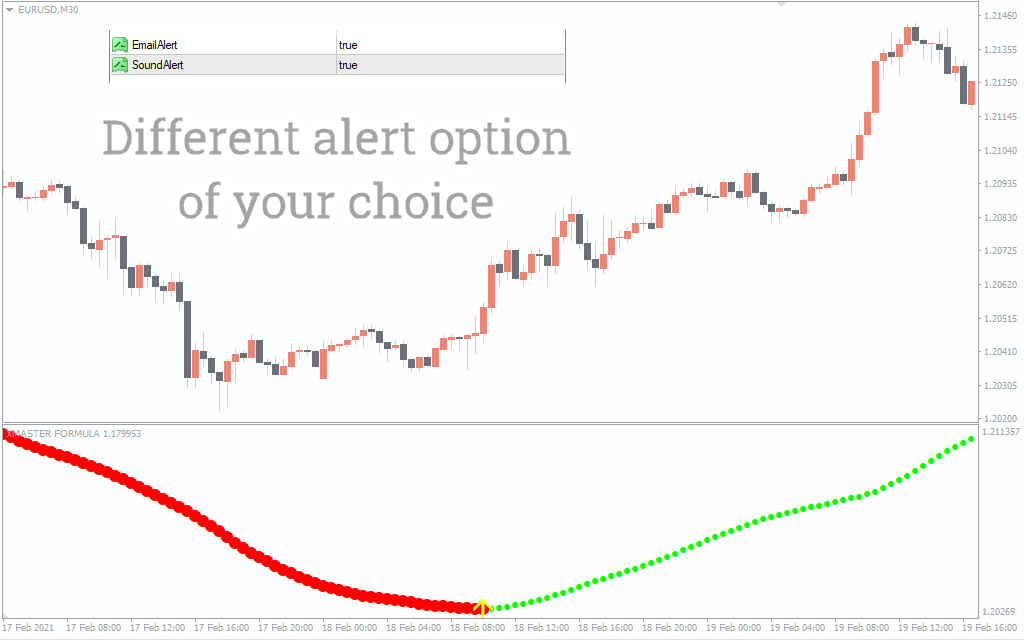
The Xmaster Formula Indicator for MT4 has a complex engine combining Moving Averages, RSI, and MACD behind the scenes. But, the output is a clear BUY or SELL arrow trading signal and a BULLISH and BEARISH trend indicator. Other trend-based tools like the SFI Indicator (Entry and Exit) and the Fiji Trend Indicator that traders frequently compare with Xmaster may also be found on our website. These indicators adhere to the same philosophy of boiling complex computations into clean, actionable signals
The indicator is best suited for both new and advanced forex technical traders using any trend following trading strategy. The indicator works well in all intraday chart timeframes and the daily, weekly, and monthly charts too. Additionally, the indicator is free to download and easy to install.
I personally tried it out on H1 and H4 charts, and the signals feel more stable and less noisy when compared to very low timeframes. Novices who get started can use it to cut down on excess trading, emotional trading and more.
Xmaster Formula Indicator For MT4 Trading Signals
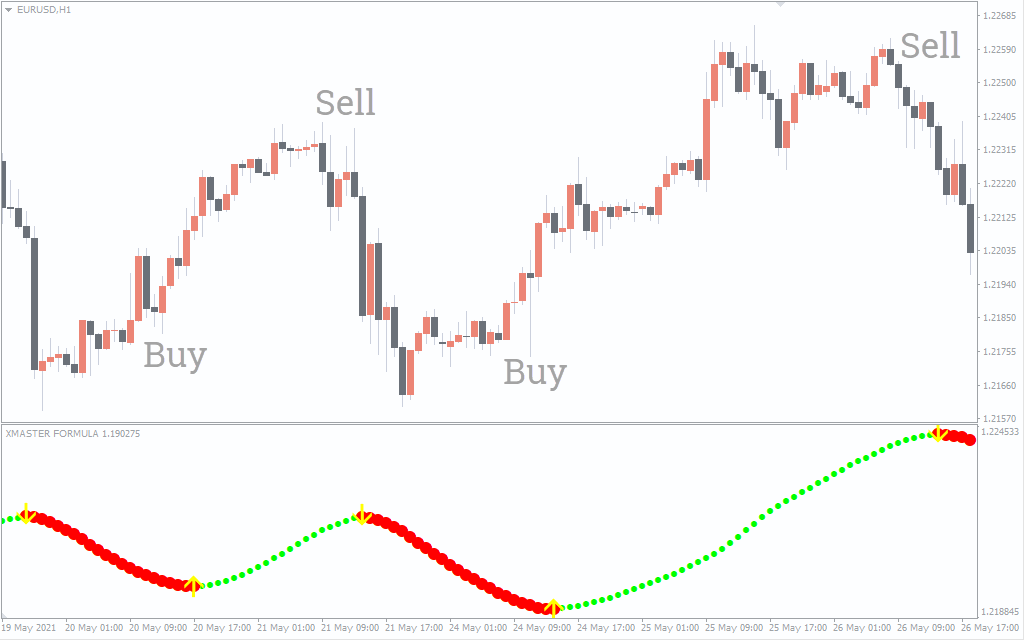
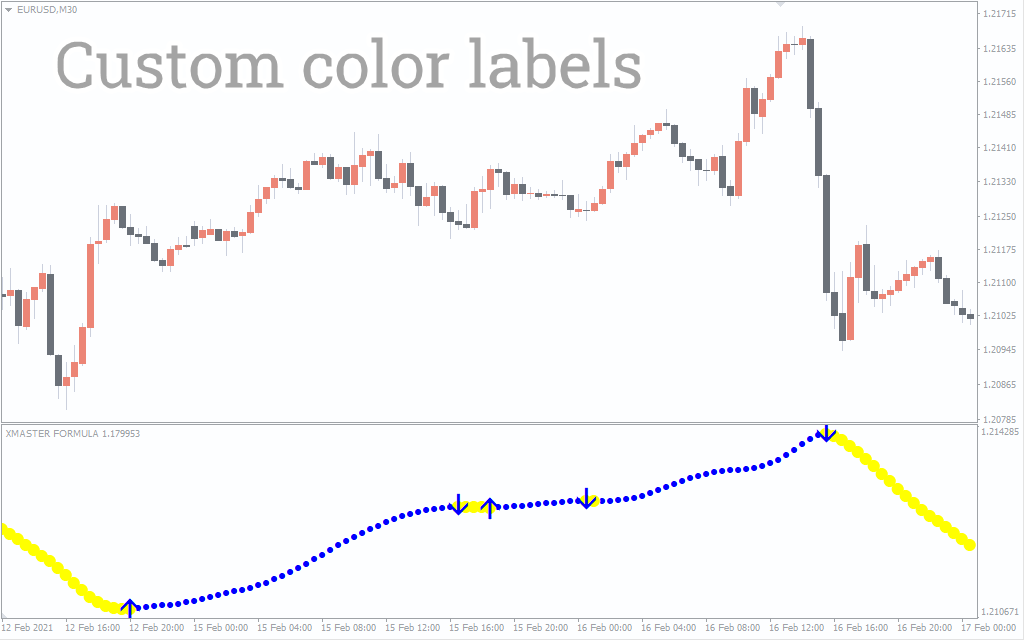
The above EURUSD H1 chart shows the Xmaster formula indicator for MT4 in action. The indicator displays the BUY and SELL arrow signals in YELLOW. The BULLISH trend in LIME and the BEARISH trend in RED. The indicator is placed in a separate window below the price chart.
What struck me is how closely the dot colors fit with the market’s overall structure. When the dots are consistently LIME or RED, it’s usually an indicator that the trend is strong enough to be freely traded.
Forex traders using the indicator to follow the trend can place BUY trade upon the formation of the YELLOW arrow in an upward direction. But, the trader should confirm the trading signal only if the indicator displays LIME color dots. In this forex technical trading strategy, the stop loss for the position is below the previous low, while the exit is at the next opposite trading signal arrow.
Likewise, the appearance of the YELLOW downside arrow indicates the possible beginning of a BEARISH trend. So, forex traders should place a SELL trade. However, the trading signal must meet the additional criteria of the presence of RED dots. In this technical strategy, the best position for a stop loss is above the previous swing high and the profit booking point is at the opposite trading signal arrow.
I’ve also found that when these signals are supplemented with simple support and resistance levels, they can provide improved accuracy too, especially in the London and New York sessions.
For best results, the forex trader should confirm the trading signal with both the arrow and the dot color. There may be instances where both the signals may not appear simultaneously, in such case the trader should wait for the appearance of the other signal too.
The Xmaster formula indicator for MT4 is a trend following indicator, so it provides the best results if forex traders can trade using multi-time frames(mtf). It is in the best interest of the trader to follow the higher timeframe trend direction and identify the best entry point in the lower time frame chart.
Most times I just identify a trend to track on H4 or Daily, then drop to H1 for more accurate entries—this is how it’s designed to be used.
Pros and Cons of the Xmaster Formula Indicator
 Pros
Pros
- Clear BUY and SELL arrows simplify decision-making.
- Combines multiple indicators into a single, clean interface.
- Appropriate for beginners as well as seasoned traders.
- Work well over several timeframes.
 Cons
Cons
- Similar to most trend indicators, it may lag during sharp reversals.
- Signals are less effective in sideways markets.
- Most effective with basic market context.
Conclusion
The Xmaster formula indicator for MT4 is a trend-following indicator, so it provides the best results for trend followers. The simplicity of the indicator with its arrow trading signals and the color dots assists every trader looking for less clutter price charts. However, forex traders must take into account the proximity of the BUY and SELL arrow trading signal with any established trendlines, support, or resistance zones and channels. Moreover, forex traders can download the indicator for free and install it easily.
According to my experience, Xmaster works best when the most actively traded instruments are used. If your focus is on those sorts of markets, I encourage you to read our article on the most trendy currency pairs to catch a glimpse of where trend-following indicators are seeing the highest returns.
Frequently Asked Questions (FAQ)
 Is Xmaster Formula Indicator a good tool for beginners?
Yes, and it’s easy to understand with the clear arrows and color-coded trend dots.
 Is the indicator a repaint of signals?
No, signals come from confirmed market data.
 Which timeframe works very well with Xmaster?
H1 and higher timeframes are often the most reliable signals.
Can it be used alone?
Yes; it works better when paired with basic support and resistance.
 Is it suitable for scalping?
It can be used for scalping, but it works best in trend-following setups.