
WATR Indicator
The WATR indicator is a suitable technical indicator for identifying ideal trade entry points. An ideal tool for detecting trend reversals and determining the direction of the market.
Description
The Weighted Average True Range (WATR) indicator is a simple MT5 indicator that shows the market trend and signals possible price changes. This is an extended version of the Average True Range indicator. The indicator smoothes the ATR by integrating a weighting factor.
The Free Download WATR indicator focuses on recent price changes and reacts quickly to changes in price behavior. It provides a simple trading signal that is easy for beginner traders to understand. Moreover, it can be used to trade all forex currency pairs on all timeframes in Metatrader 5.
How to Use the WATR Indicator
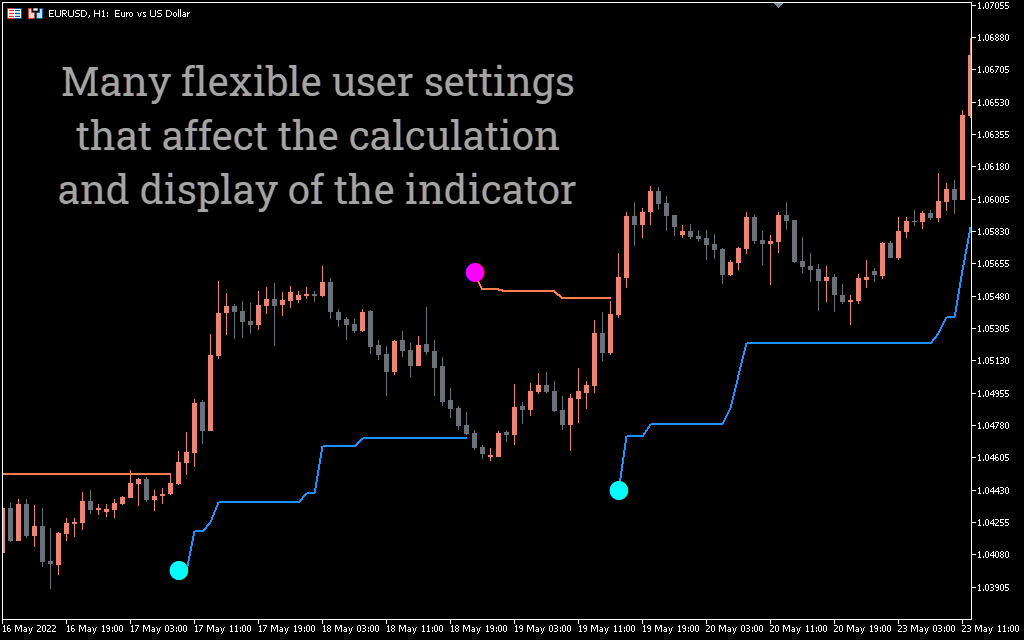
The technical indicator generates blue and coral lines along the price depending on the direction of the price, as well as aqua and majenta circles at the best trade entry points.
Buy Signal
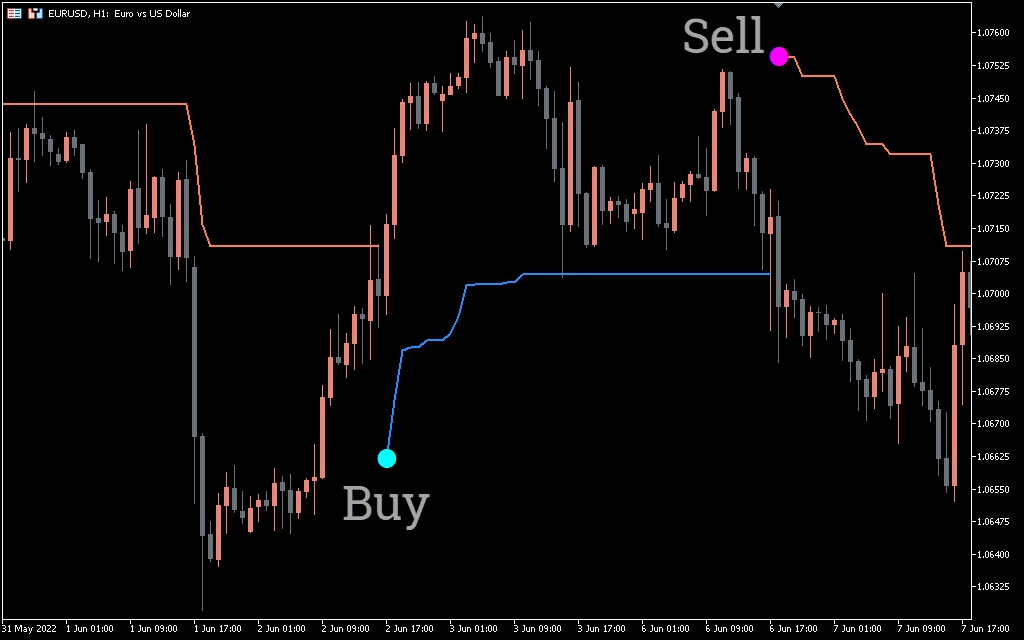
A buy signal occurs when an aqua circle appears and a coral line appears after the solid blue line. Wait for the candle where the coral line seems to close. Make sure the candle closes above the previous blue line. In general, go long when the coral line appears and candles close above the indicator line.
Sell Signal
A sell signal occurs when the indicator draws a pink circle and a blue line after the end of the coral line. Wait for the candle to form below the coral line and close below the blue line. Go short when the curvy blue line appears and the candle closes.
Exit strategy
Close the trade when a blue line appears above the candles in an uptrend and a coral line appears below the candles in a downtrend. This is a clear sign that the price has reversed.
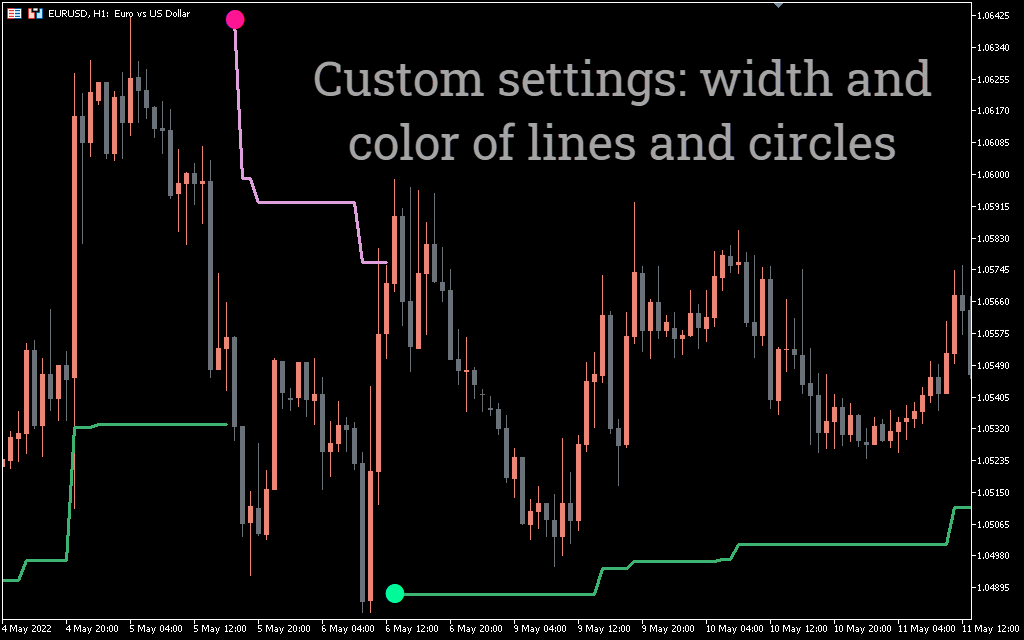
The indicator lines work great as a trailing stop. The indicator allows you to configure options for extended characters. You can use the indicator as a standalone indicator or with other trend based indicators to get better signals. Take profits according to a 3:1 profit to loss ratio.
Chart Example of WATR Indicator
The above chart shows the price movement of the UK against the Australian dollar on a daily chart. The indicator draws a coral line during an uptrend. In fact, candles close above the indicator line in a bull market.
The indicator then forms a sinuous blue line as the trend changes from up to down. During a bearish move, the indicator draws a sinuous blue line. Candles close below the indicator lines, making the indicator line an ideal stop loss point.
Conclusion
The WATR indicator is a simple but effective technical indicator. It does not require additional calculations and allows you to quickly and easily find good entry points. You can use it as a standalone indicator and combine it with price action and other technical tools to make informed trading decisions.