
Ulcer Index Indicator
The Ulcer Index is an excellent indicator for measuring downside risk. It helps ensure your long positions remain profitable.
Description
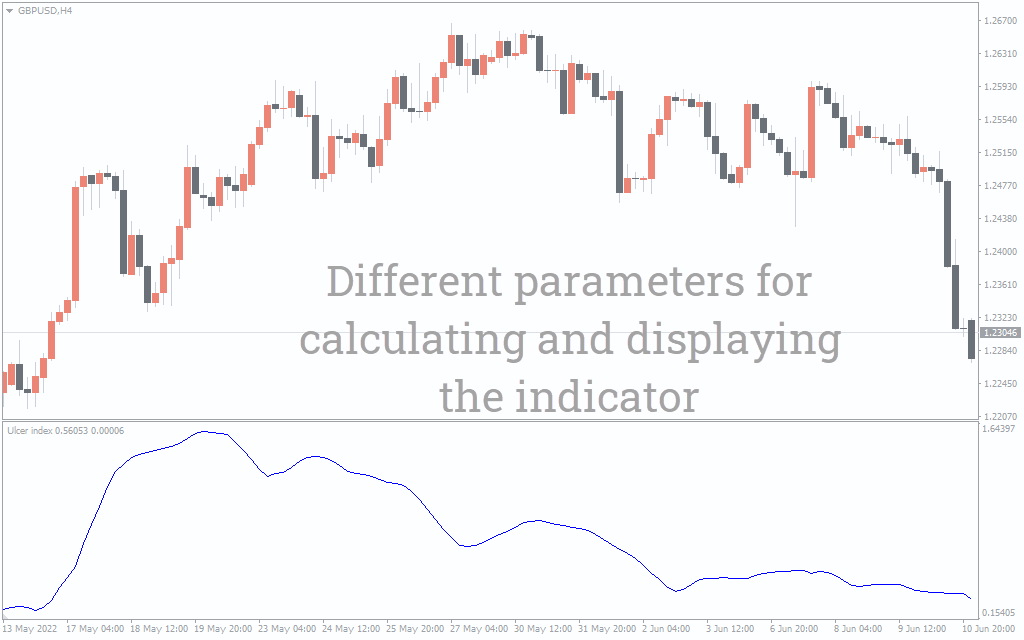
The Ulcer Index is quite a unique indicator. It was developed in 1987 by Peter Marin and Bryon McCann. The indicator is based on the assumption that uptrend momentum is profitable to you. It, therefore, measures the downside risk in both the period and depth of the price decline.
Personally, I found this tool especially useful when managing longer-term swing trades. During testing, I paired it with more momentum-sensitive indicators like our Money Flow Index Indicator and the Choppiness Index Indicator to confirm whether the market is trending or simply ranging. The Ulcer Index helped me gauge whether the drawdowns were within acceptable levels and whether I should hold the trade longer. Installing it was simple—just attach it to your chart, and it begins analyzing drawdowns automatically, no extra configuration needed.
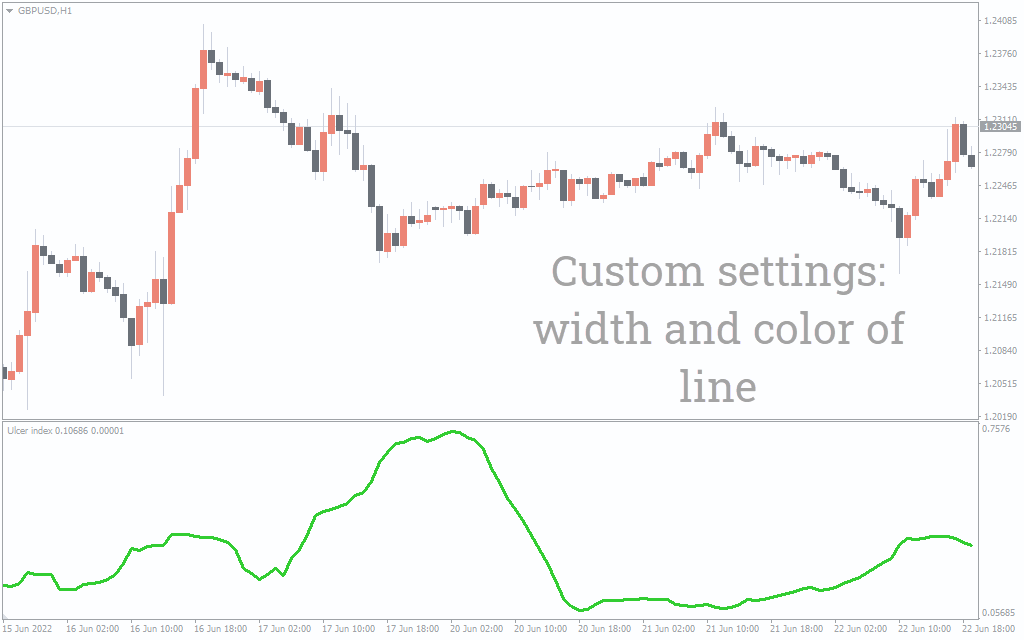
You can use the indicator to trade any instrument in any time frame.
How to Use the Ulcer Index Indicator
The indicator index increases significantly as the price moves from the recent high. This means the index will increase when the price plummets. It starts reducing as the prices move towards the recent high. The index hits zero if the currency pair makes a higher high with each candle.
One tip from my setup: I always keep an eye on the slope of the Ulcer Index curve — a sharp rise is usually my cue to review stop-loss levels or tighten my exposure.
You should be cautious if you are long on trade and the index starts increasing. If the index increases sharply, you might want to exit the trade or use tight risk management. However, if the index falls, you should consider holding the trade or adding more positions. Ideally, you will want the index to stay near the zero level. This indicates that the market is making new highs with each candle.
Trading Example
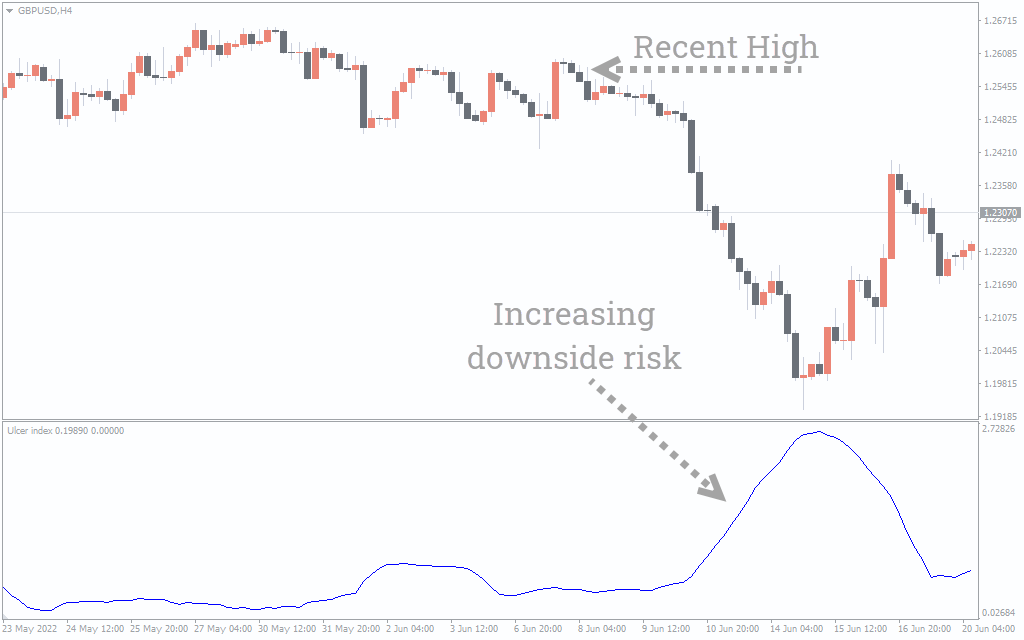
See how the indicator index moves flat near the zero level. However, the index increases as prices plummet, moving away from the recent high. The index falls when the uptrends resume and the price moves toward the recent.
In live trading, I’ve noticed this drop-off is often one of the earliest warnings before volatility hits. I like to cross-check this behavior with price structure on the chart.
Pros and Cons of the Ulcer Index Indicator
 Pros
Pros
- Accurately measures drawdown severity.
- Excellent for long-term trend monitoring.
- Easy to install and configure on MT4.
- Works on all timeframes and instruments.
- Free and lightweight.
 Cons
Cons
- Doesn’t generate entry/exit signals directly.
- Best used in combination with other tools.
- Not suitable for scalping or short-term trades.
- No alerts or arrows for visual signals.
Conclusion
The ulcer index is an excellent indicator for tracking the performance of your long position. It comes in handy if you are holding a trade expecting it to rise. You want to ensure the index is falling or moving near the zero line for your long position to be profitable.
If you’re interested in practical tools that help you maintain solid trade management, don’t miss our blog post on the Xmaster Indicator review—it’s a great complement to the Ulcer Index when building a reliable trading setup.
Frequently Asked Questions (FAQ)
 Can the Ulcer Index be used alone for trading?
Not really. It’s a great supporting tool but not designed to generate buy or sell signals. I usually pair it with other indicators like RSI or Moving Averages.
 Is the Ulcer Index suitable for short-term trading?
It’s not ideal for scalping or M1/M5 timeframes. It performs best when evaluating medium to long-term trades, especially those where holding periods matter.
 How do I know when to exit a trade using this indicator?
If you’re in a long position and the index starts rising rapidly, it may be time to reduce exposure or move your stop loss. A flat or falling index is often a good sign to hold.
 Does it repaint historical data?
No, the Ulcer Index is a non-repainting indicator. Once a candle is closed, the value is fixed.
 Can I use it on crypto or stocks?
Yes, absolutely. I’ve tested it on Bitcoin and Apple stock charts—it works well as long as you apply it in trending conditions and monitor drawdowns appropriately.