
SMA Crossover Indicator
Learn to identify highly probable trading opportunities using the best SMA crossover signal indicator for MT4.
Description
The SMA Crossover is a technical MT4 indicator especially developed for trend-following trading strategies. You can apply it to forex, stocks, and cryptocurrency charts for assessing current market trends.
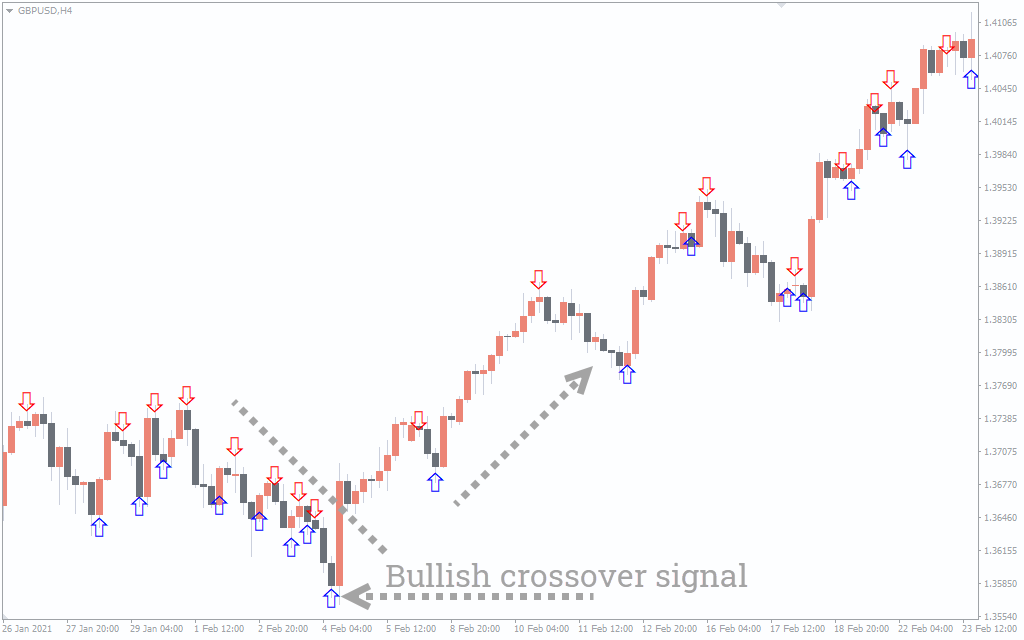
This indicator applies two moving averages with different parameters. Whenever the fast SMA moves above or below the slow MA, it immediately generates a crossover signal using blue/red arrows. The direction the arrow points to indicates whether it is a bullish or bearish trend signal.
This guide will explain how to determine market trends and potential buy-sell setups using the SMA crossover indicator for MT4.
How to Trade Forex and Stocks Using the SMA Crossover Indicator in MT4
The SMA Crossover indicator applies a crossover between 1 and 34-period simple moving averages. The default settings may generate frequent signals. Although, you can always change the parameters of the fast and slow MAs to adjust the signal frequency.
A blue arrow signal suggests the fast MA has exceeded the slow MA, plotting a bullish crossover signal. Once you get a bullish trend confirmation, look for relevant price action signals like price breakouts at resistance or rejections at support.
The price breaks a support or declines from a resistance level while the indicator plots a red arrow means it’s time to activate a sell order.
Conclusion
SMA crossovers are considered a key technical strategy for identifying correct trend directions. Simple moving averages may react slower than exponential moving averages (EMA), but it always carries a greater confirmation of current market bias. Besides trend-based trading strategies, the SMA crossover for MT4 also helps determine strong support/resistance zones.