
Omega Trend Indicator
Forex BUY and SELL signals from the best Omega Trend Indicator. Find the direction of the trend.
Description
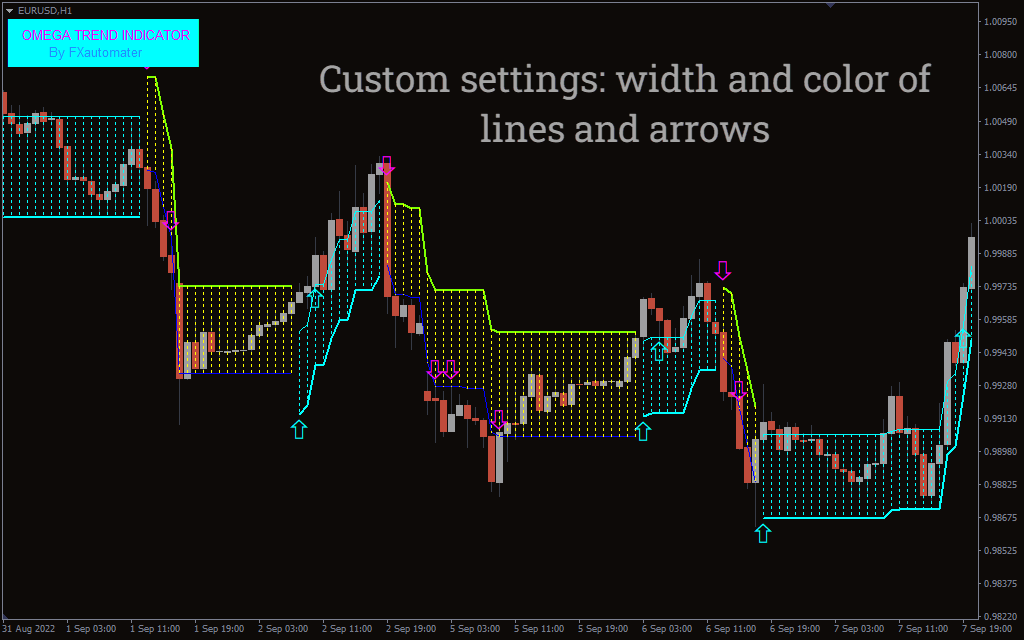
The Omega Trend Indicator is a simple MT4 indicator that tells about the trend’s direction. The indicator plots histogram, pivot lines and arrows to find the overall trend. The indicator draws aqua, and magenta color lines and arrows to signify the uptrend and downtrend.
For traders who like tools in the same family, you might also be interested in our Half Trend Buy Sell Indicator and the Forex Pandorum Indicator, both of which bring unique variations of trend analysis that complement the logic behind the Omega Trend Indicator.
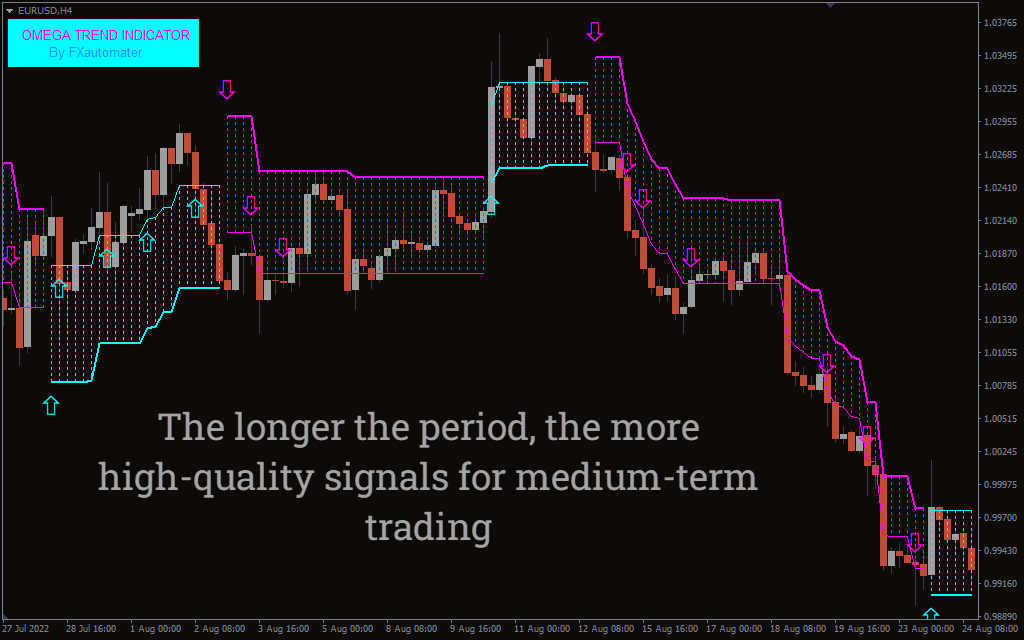
When I first tested the Omega Trend Indicator, the setup was quick and straightforward — I just dropped the file into my MT4 indicators folder and attached it to my chart. The moment I loaded it, the aqua and magenta arrows became visible right away, which made it very intuitive to read. I particularly appreciated how clearly the histogram and pivot lines complemented the arrows, giving me a fuller picture of the market’s direction. In my experience, the indicator reacts more cleanly on higher timeframes like H4 and D1, where market noise is lower.
The Omega Trend Indicator works best on all timeframes. However, it’s better to apply it on higher timeframes.
Omega Trend Indicator BUY/SELL signals
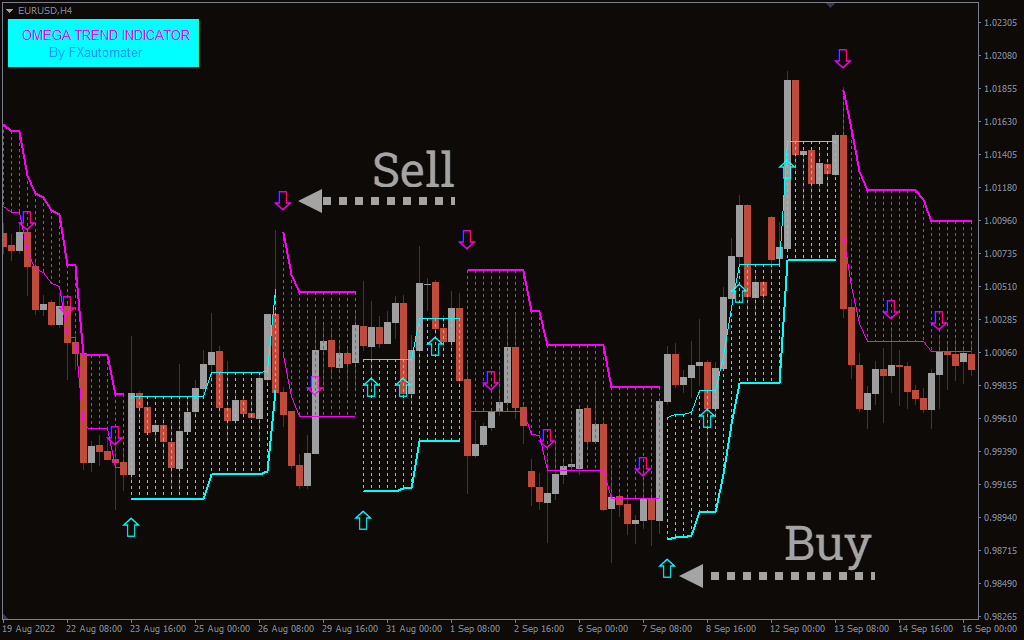
The above EUR/USD H4 chart shows the BUY and SELL signals with the indicator. To determine BUY and SELL signals, traders need to look at the aqua and magenta color lines and arrows.
Traders can enter long positions whenever the indicator plots aqua color lines and arrows. On the other side, when the indicator plot magenta color lines and arrow, it’s a sell signal. Traders can use the Indicator along with other indicators to confirm the overall trend’s direction. From my own observation, combining this tool with a moving average or RSI filter helped reduce false entries, especially during sideways markets.
Pros and Cons of the Omega Trend Indicator
 Pros
Pros
- Very simple and beginner-friendly visual interface.
- Works across all timeframes and currency pairs.
- Clear arrows and color-coded lines make signals easy to interpret.
- Fast to install and configure with no steep learning curve.
 Cons
Cons
- Can generate false signals in ranging markets.
- Best used with additional confirmation tools.
- Too many arrows on lower timeframes may overwhelm novice traders.
Conclusion
The Omega Trend Indicator draws the pivot lines, histogram, and arrows to tell the direction of the trend. By looking at the indicator’s colors, traders can take their positions. In addition, you can download the indicator for free on our website.
For those looking to expand further into trend analysis, I recommend also reading our blog post on Currency Pairs with High Volatility, as it explains how choosing the right pairs can significantly improve the performance of tools like the Omega Trend Indicator.
Frequently Asked Questions (FAQ)
 Does the Omega Trend Indicator repaint?
No, once a signal arrow is plotted, it stays fixed. However, signals are confirmed only after the candle closes.
 Which timeframe is the most reliable?
Although it can be used on all timeframes, higher ones like H4 and D1 tend to provide cleaner and more reliable signals.
 Can I use this indicator for scalping?
Yes, but expect more noise on M1 and M5. Combining it with a filter indicator is recommended for scalping.
 Is the indicator suitable for beginners?
Absolutely. Its color-coded arrows and lines make it easy to follow without requiring advanced trading knowledge.
 Can I combine it with other strategies?