OBTR Indicator
This is an OBTR indicator for trading forex, stocks and other markets. It uses volumes and is suitable for buying and selling both on trend and counter-trend. It doesn’t repaint. Contains alerts.
Description
This indicator was developed by Tom Bierovic, OBTR stands for On Balance True Range.
The OBTR indicator is based on the classic OBV (On Balance Volume) indicator, which is included by default in the MT4 platform.
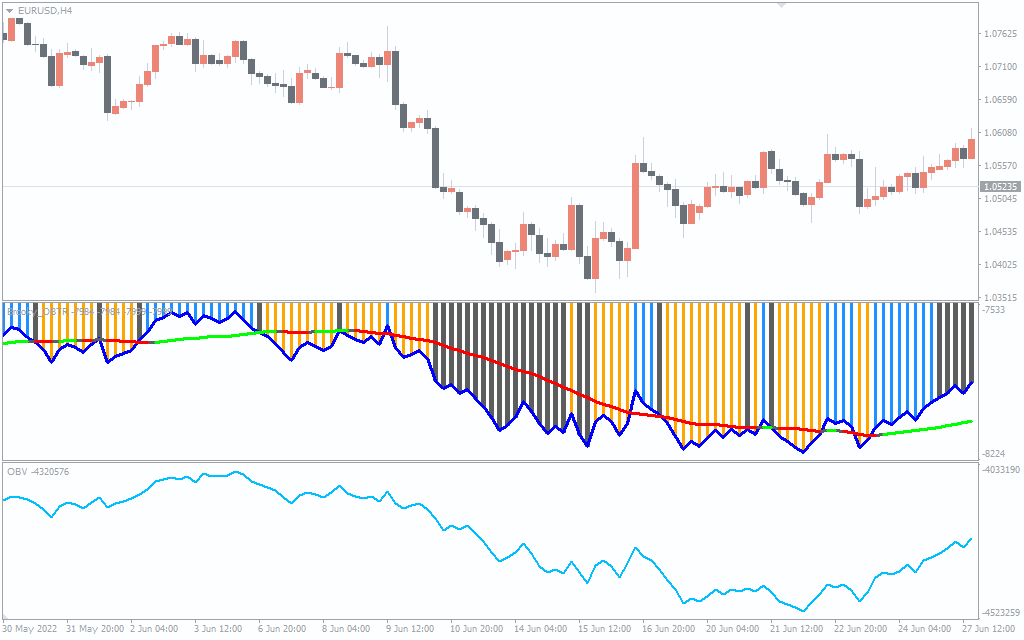
The chart below shows the price bars for the EURUSD forex pair. The OBTR (above) and OBV (below) are in the indicator zone.
As you can see:
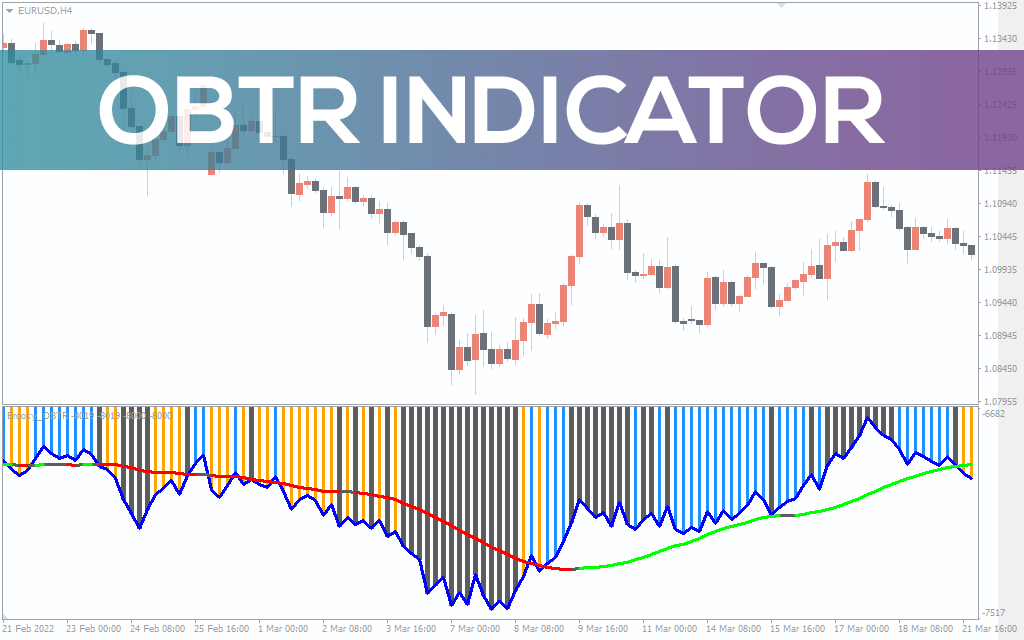
- the main OBTR line is blue, and it replicates the OBV line;
- the additional line that changes color between red and green is the moving average for the main OBTR line.
In addition, the OBTR contains a 3-color histogram of gray, blue and orange bars.
How to use the OBTR indicator for trading
The OBTR Indicator does not give simple buy and sell signals with arrows. Using the OBTR indicator readings, forex traders need to additionally analyze the chart to make decisions about opening or closing positions.
Above all, OBTR will be useful for trend traders.
Here are the basic rules:
- If the moving average is red, then the general trend is bearish and preference should be given to opening short
- If the moving average is green, then the market is in a bullish trend, preference should be given to opening long
- If the histogram is blue – look for a signal to open long
- If the histogram is orange – look for a signal to open short
- If the histogram is gray and the main OBTR line is far from the moving average, this is a reason to close a position. Or open a position against the
If this set of rules seems super complicated, the examples below will help you understand how to trade forex using the OBTR indicator.
Sell Signals
As an example in the chart below (forex market GBPUSD, 1D), the signal to sell comes when:
- The moving average is pointing downwards and is red, which means that the market is in a bearish trend.
- Histogram bars change color from blue to orange (1). The main OBTR line is pointing downwards.
This indicator reading can be interpreted as the bullish short-term momentum is over, and the bearish trend is ready to resume. A stop-loss can be set above the previous local high.
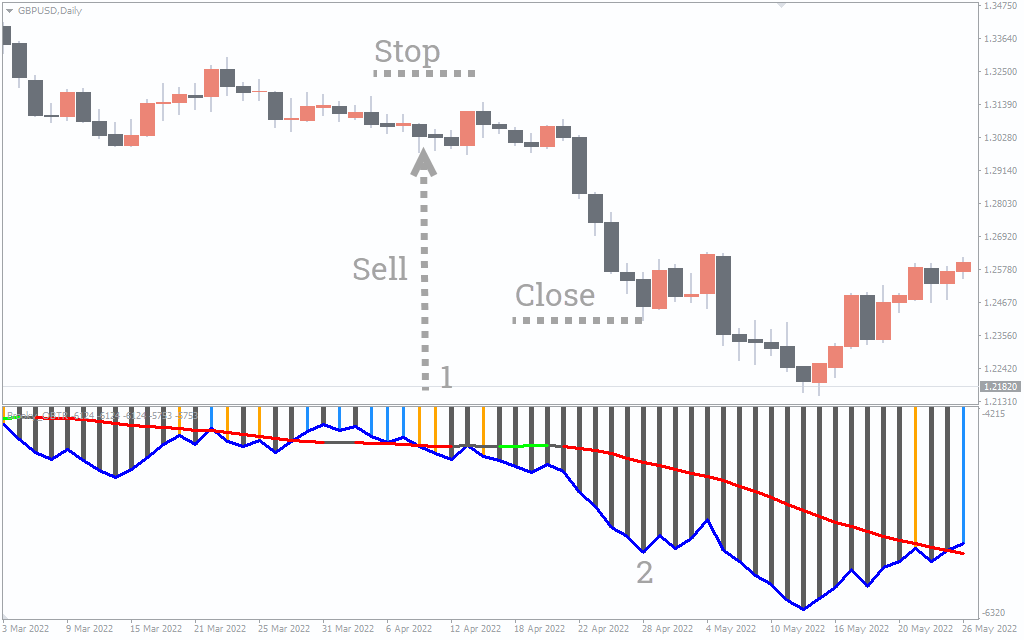
Exit a position when the bars are gray and the moving average is far (2) from the main line.
Buy Signal
The signal to buy comes when:
- The moving average is green and pointing upwards.
- The main line of the OBTR indicator is near the moving average, and the bars are blue (1). This indicates that we should look for a signal to enter the long
A stop-loss may be placed below the previous local low.
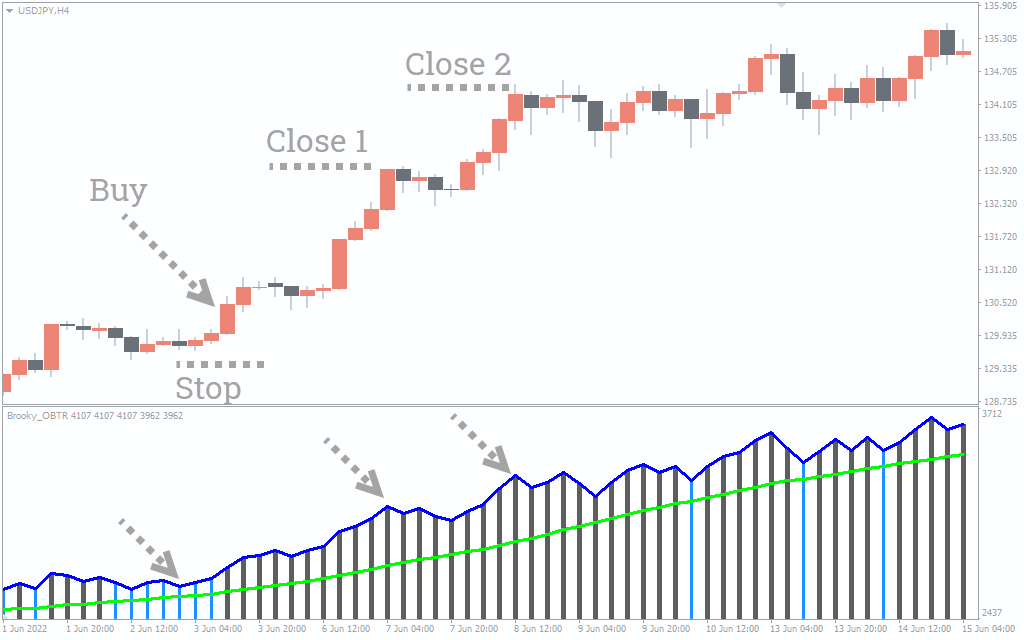
When the bars are gray and the main OBTR line is far from the moving average – this is an argument to close a position (for example, partially).
When the next time the main OBTR line turns out to be at a considerable distance from the moving average – it is possible to close the position completely.
Counter-Trend Signal
Attention! Trading strategies against the trend is usually not recommended for novice traders. On the other hand, the potential to profit from trading against the trend is great, as it is a way to buy on the lows and sell on the highs.
Here is how the indicator can help (shown below with an example of the EURUSD, M30 forex chart).
The first arrow indicates that the OBTR bars are gray, and the main line is away from the moving average. This is a signal to open a sell trade when the main line turns down. In this case, the stop-loss can be set above the local high.
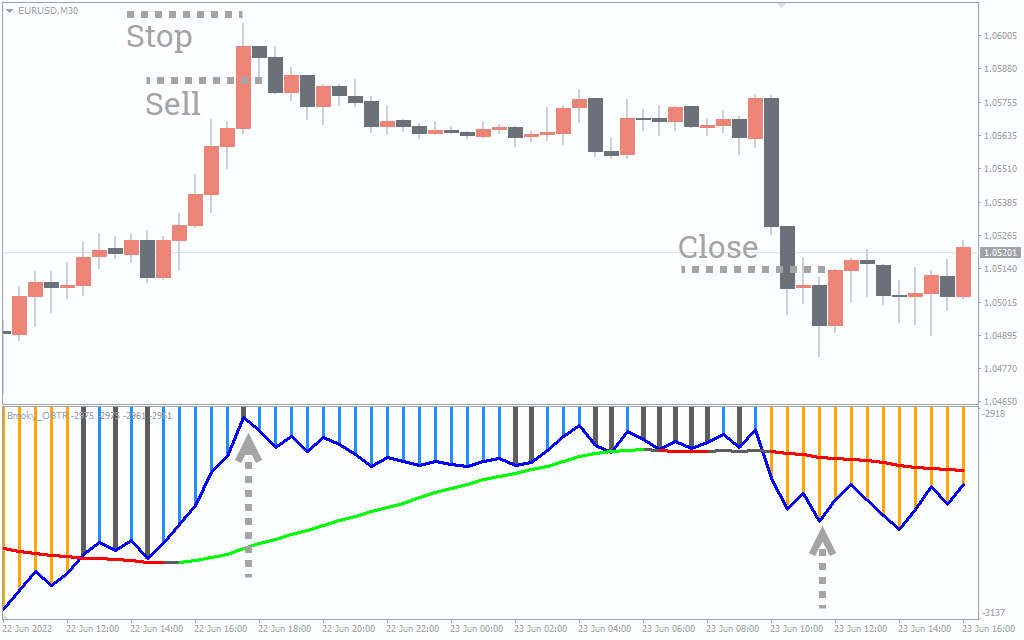
Then comes the opposite signal – the bar is gray, the OBTR indicator is far below from the moving average. When the main line turns up – you close the short position.
Peculiarities of trading with the OBTR indicator
The indicator works better on higher timeframes (daily, weekly charts, for example). On fast timeframes, such as M5, the OBTR indicator gives many false signals.
When the main line and the additional line often overlap, it means that the market does not have a steady trend.
Since the indicator has a built-in moving average, you should be prepared for some kind of indicator lag from the latest market action.
OBTR provides enough freedom to combine different strategies and timeframes. For example, you can determine a general trend direction on a higher timeframe with OBTR, and then speculate on lower timeframes, for example by trading support or resistance line breakouts.
Conclusion
The OBTR Indicator for Metatrader helps to trade both along the trend and against it. The indicator is hardly suitable for beginner traders because it requires additional analysis.
Advantages of the indicator:
- Non-repaint.
- It is applicable to any markets: forex, stocks and others.
- It is based on volume
- It can be combined with other methods – for example, trading by trendlines, patterns of technical
Disadvantages of the indicator:
- There are no automatic arrows. Taking into account the readings of this indicator, traders need to conduct additional analysis.
- It has no
- It is characterized by lagging due to the moving average.
- The exact formula by which the indicator is calculated is unknown.
Before you start using the OBTR indicator, practice on a demo account. All forex brokers with Metatrader platforms provide this service. Make sure you have experience interpreting OBTR signals, and only then risk real money.
Download and install OBTR Indicator for MT4 indicator for Free Now!