
MACD on Chart Indicator
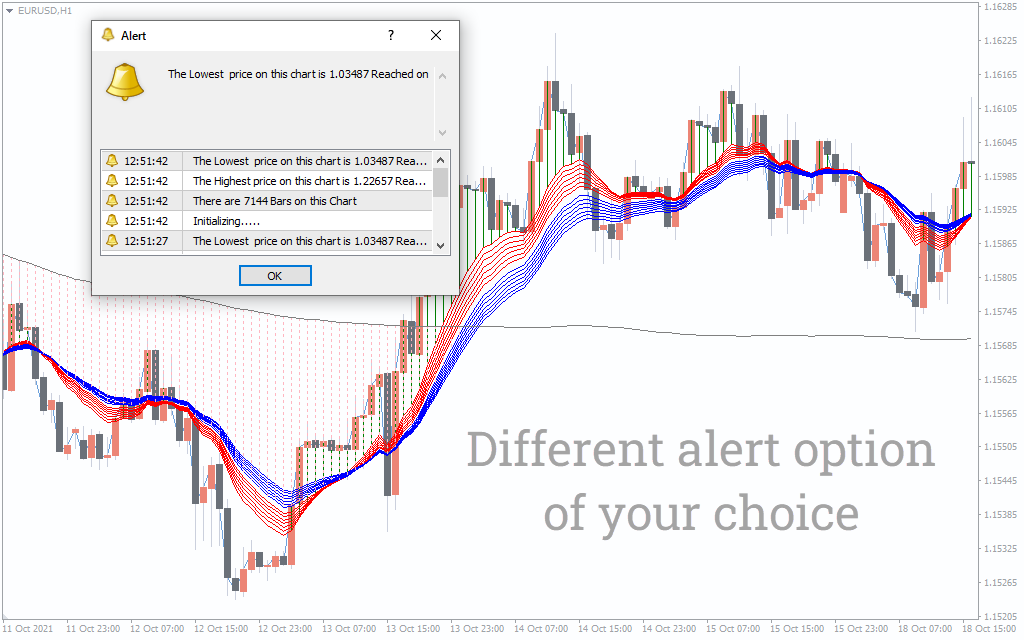
Make the best forex & stock buy-sell decisions by using the MACD on Chart Indicator in Metatrader 4. Signals market momentums, trend reversals & precise trading zones.
Description
The MACD on Chart Indicator is an automatic trend scanner that closely monitors the changes in market momentums. Generally, the moving average convergence divergence indicator works in a separate window to signal the momentum status. However, the MACD on Chart Indicator demonstrates the trend and momentum conditions in the main chart window.
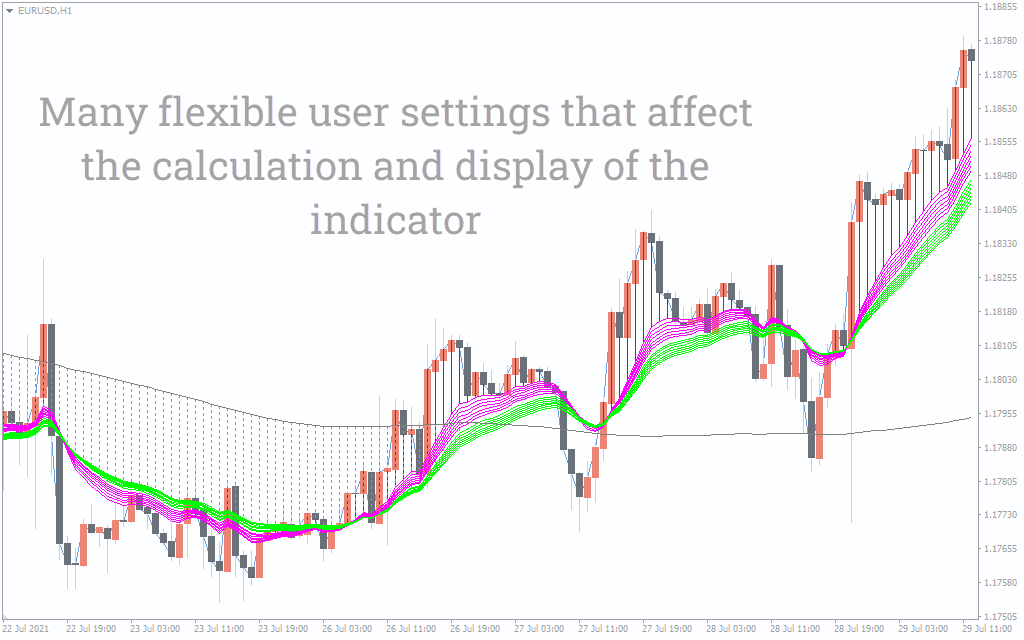
This indicator plots a set of seven individual fast and slow EMAs for generating crossover trend signals. Besides, it applies a 200-period MACD line for identifying overall market momentums. The composition of EMA crossovers and momentum signals helps traders anticipate precise buy/sell opportunities.
Our in-depth review suggests that the MACD on Chart Indicator is a good match for all types of trading instruments, including forex and stocks. Besides, it suits MTF trend and momentum analysis in MT4 platforms. This guide explains how to use the MACD on Chart Indicator in MT4 for determining potential buy-sell signals, including chart examples.
How to trade forex and stocks by using the MACD on Chart Indicator in MT4
The set of red curvilinear around the price line represents the fast EMA, and the blue lines show the slow EMA levels. The gray line across the chart shows the current MACD value. We’ll determine the current market momentum condition depending on the price position compared to the MACD level. The momentum status of the market will tell you whether you should consider a buy or sell signal.
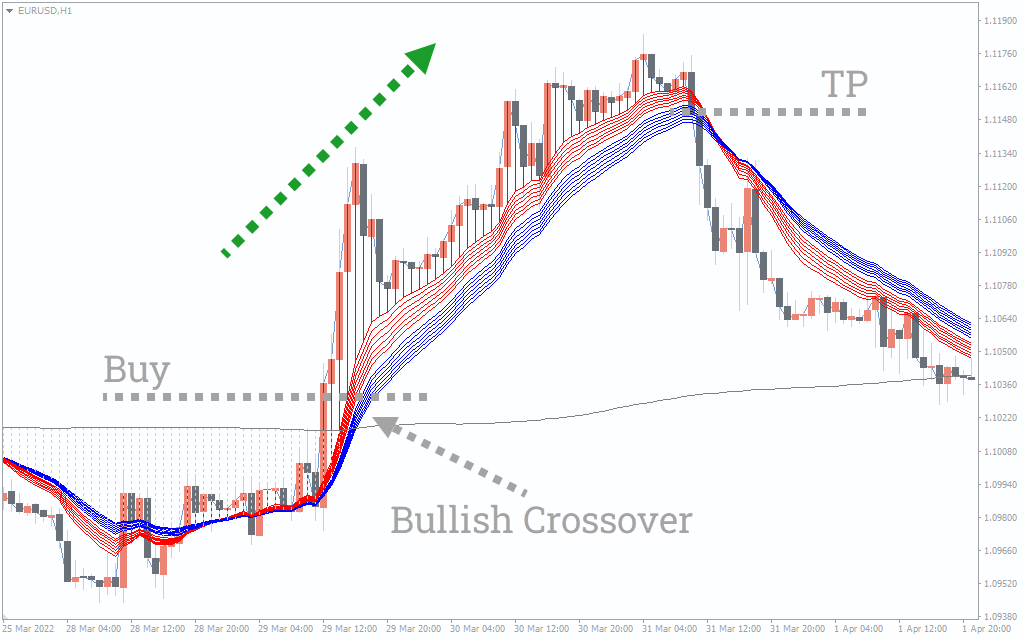
For instance, the price holding above the MACD line indicates the momentum is bullish, and it is time to look for long opportunities only. So, once you get the momentum confirmation, wait for the right crossover between the slow and fast EMAs before entering a trade.
In the above example, EUR/USD breaks above the MACD line, indicating bullish momentum. At the same time, the fast EMA (red) moves above the slow EMA (blue), confirming a bullish trend. According to the MACD on Chart trading strategy, it is a perfect setup for going long. Once you go long, consider an exit after the price breaks below the EMA levels.
Conversely, go short when the price drops below the MACD line and the EMAs plot a bearish crossover simultaneously. Besides, you can decide to exit short right after the price spikes above the EMA lines.
Conclusion
The MACD on Chart Indicator follows a dynamic process of identifying trend-following buy/sell signals. Also, it considers multiple technical factors like EMAs, MACD line, and crossover signals for filtering the trade signals. These features help traders avoid weak trades and pick the best possible opportunities with higher success rates. Besides beginners, advanced traders will also find MACD on Chart Indicator a useful tool for analyzing market momentums and trend conditions with greater accuracy.