
Ichi 360 v8 Indicator
Forex market signals from the best Ichi 360 v8 Indicator for MT4. Find the next support and resistance levels and bullish and bearish momentum.
Description
The Ichi 360 v8 Indicator uses the Ichimoku Cloud to determine the overall market trend. Like the traditional Ichimoku, there are multiple aspects of the indicator.
First, we have the traditional Ichimoku Cloud lines. They are PA (Leading Span A), P/KS (Kijun-sen), TS/KS (Tenkan-sen), and CS (Chikou Span). This indicator doesn’t consider the Leading Span B line of the Ichimuko Cloud.
Next, there is a profit/loss calculator. The indicator calculates the P/L based on the current market trend and the lot size.
Finally, there are support and resistance levels. The good thing is this indicator works on all timeframes.
How to use the Ichi 360 v8 Indicator for MT4?
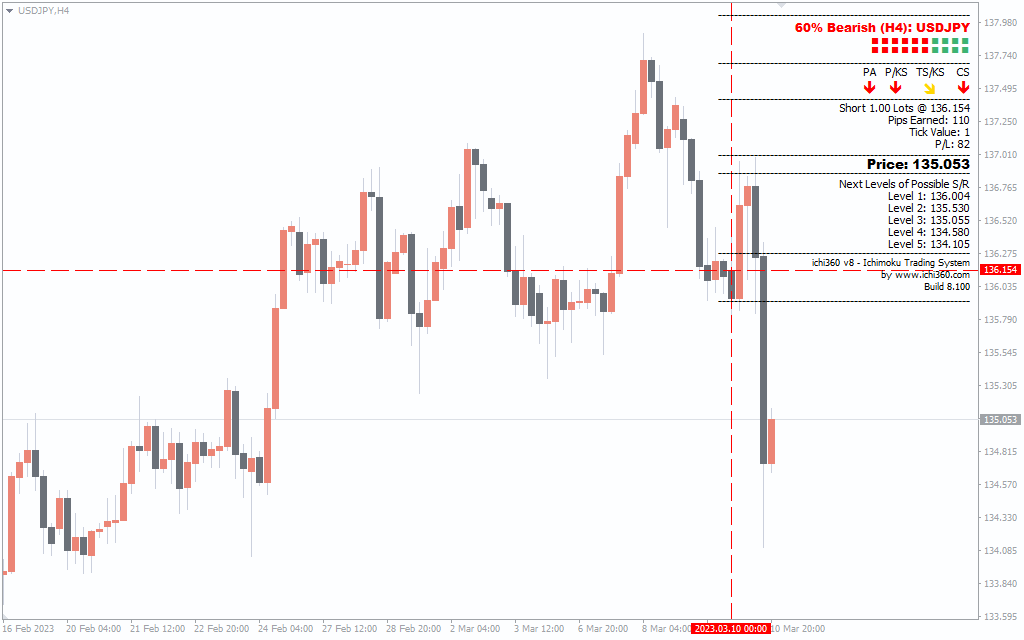
The above USD/JPY H4 chart shows the Ichi 360 v8 Indicator on the chart.
When looking for the BUY/SELL signals, you have to combine all the aspects of the indicator. For example, all the Ichimuko Cloud lines are positive in the chart above, so there’s a strong bullish momentum.
Also, with the potential support and resistance levels, you can set exit and profit targets accordingly.
You can also combine others indicators like the RSI or the Moving Average with indicator to confirm the overall trend.
Conclusion
The Ichi 360 v8 Indicator for MT4 uses the Ichimuko Cloud to determine support/resistance levels and bullish and bearish momentum. By finding the key info, you can take positions accordingly.
You can download the indicator for free on our website.