Forex Strategy Indicator
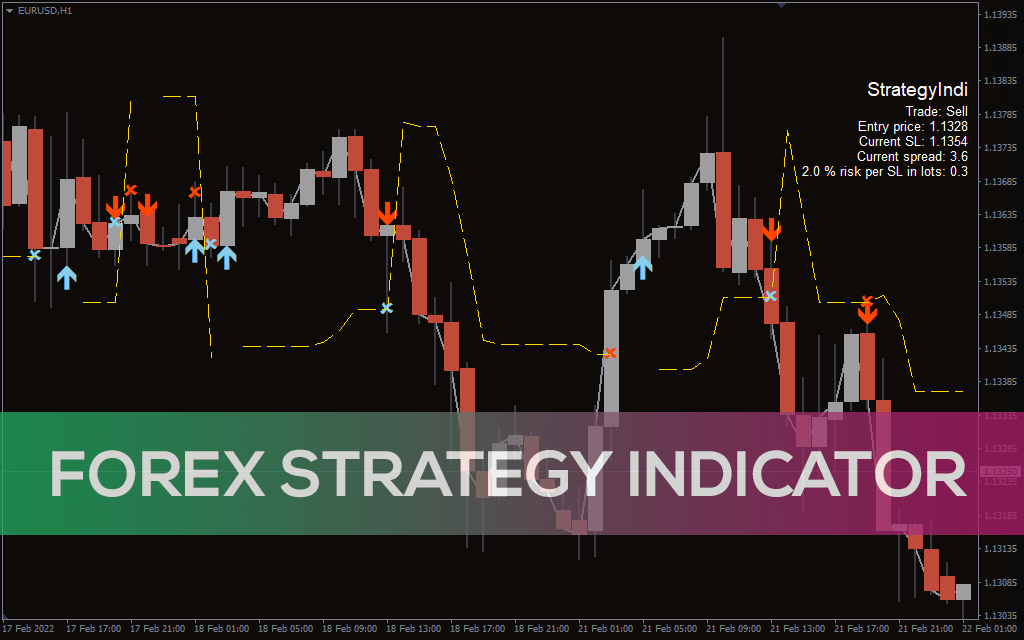
Forex Strategy indicator doesn’t repaint. It is very easy to use, showing with arrows where to enter a position and where to exit. The indicator is provided with alerts.
Description
The Forex Strategy Indicator is designed to be the best solution for those who are looking for the easiest way to trade forex.
The indicator will help novice traders develop discipline and trend-following skills.
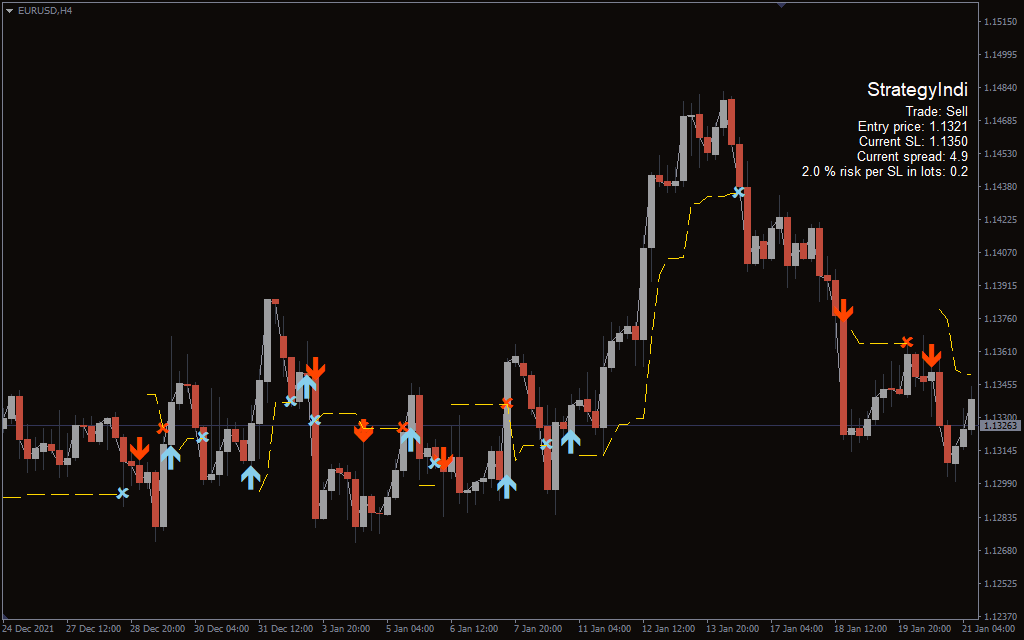
Download the Forex Strategy Indicator, then add the indicator to your chart in the Metatrader terminal.
You will see the following picture:
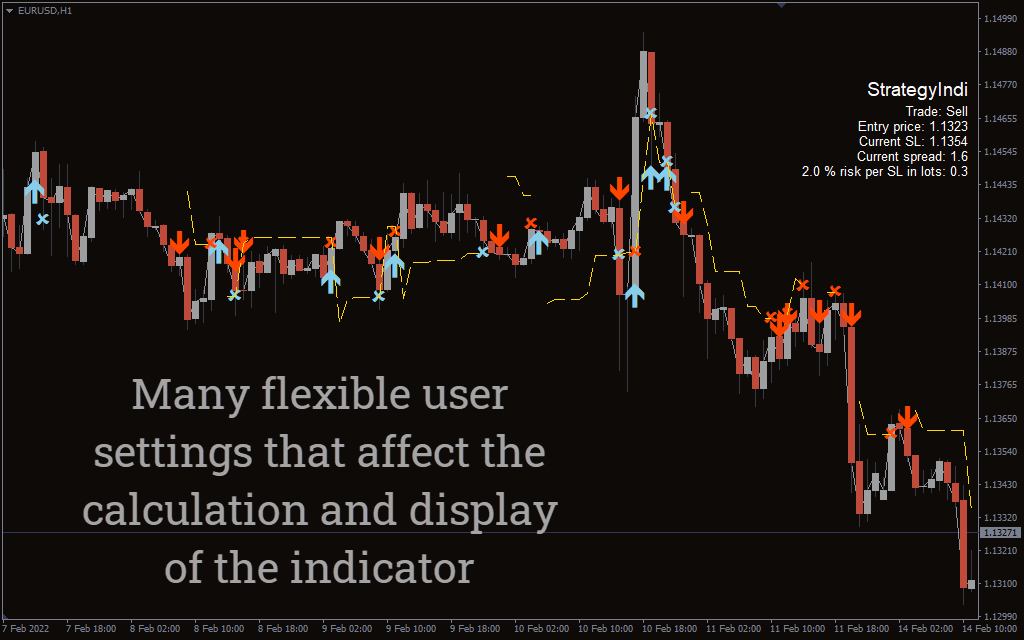
- Blue arrows show entry points to long position.
- Blue crosses show points for closing long position.
- Red arrows show entry points to the short position.
- Red crosses show entry points to short position.
Arrows and crosses appear automatically.
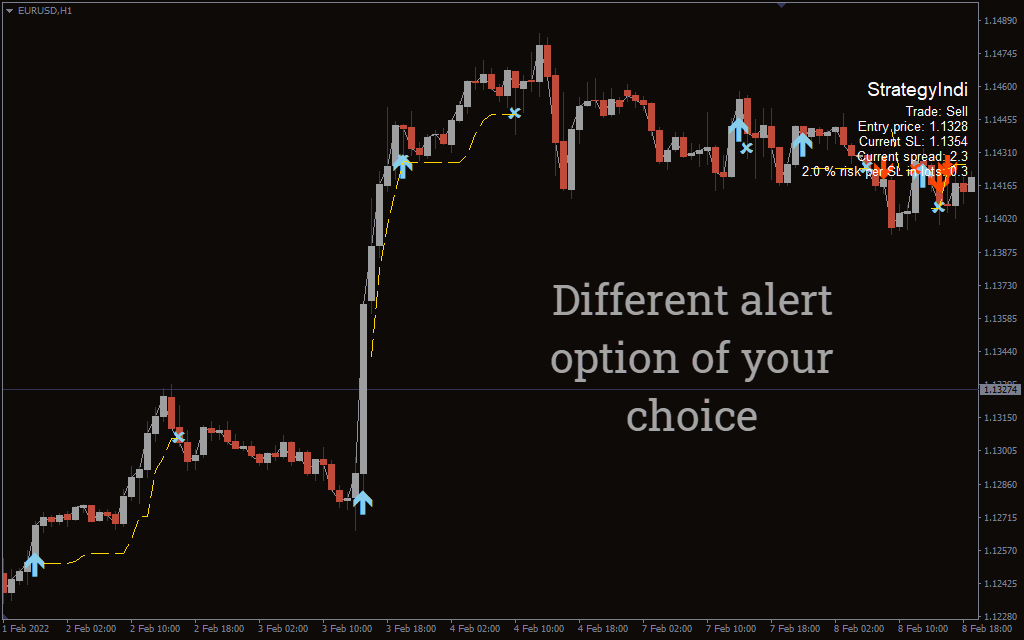
For convenience, the Forex Strategy Indicator contains alerts – you will be notified immediately when the conditions for trades arise.
In fact, Forex Strategy Indicator is a visualization of a complete trading strategy.
What is the difference between an indicator and a strategy?
An indicator is a tool, which helps to define the current market situation.
A strategy is a more complicated concept. Usually a strategy contains rules for opening/closing a position and indicators are often used to formulate these rules.
How does the Forex Strategy Indicator work?
The Forex Strategy Indicator is based on two things:
- Two exponential moving averages for finding entry signals;
- classic Chandelier indicator (displayed with a yellow dotted line) for position management.
By trading on moving averages, you can benefit from following the trend. And the Chandelier indicator will help you stay in the trend as long as possible.
The feature of the Forex Strategy Indicator is that it leaves the trader the final choice – to trade or to skip the buy/sell signal.
Example #1. Buy Signal
The USDJPY M30 chart below shows an example of an intraday buy trade.
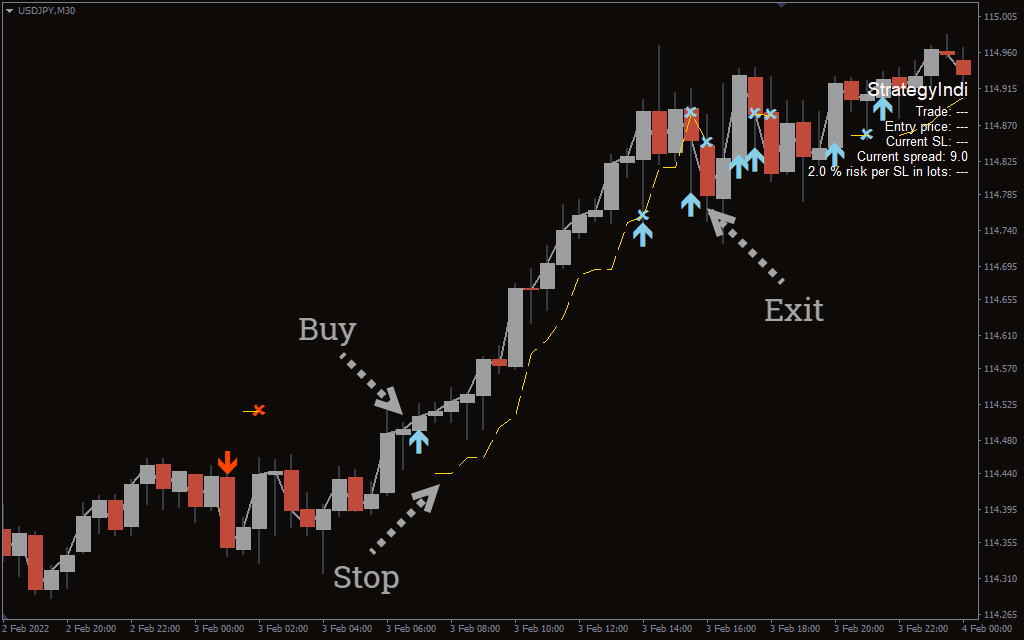
A blue arrow (buy signal) appears when the market shows signs of a bullish trend.
All you need to do is to enter a long position immediately after the signal, or set the buy-limit order just below the price at which the buy signal was received.
A protective stop-loss is set on the yellow dotted line calculated by the Chandelier technical indicator.
As the bullish trend develops, you move the stop-loss higher and higher (trailing stop technique).
The Exit marker shows the point to exit from the position.
By the way, on the same bar there was a second signal to open a long position, but this signal did not bring any more profit.
Example #2. Sell Signal
The EURUSD M5 chart below shows how you can use the Forex Strategy Indicator to trade during a bearish trend intraday.
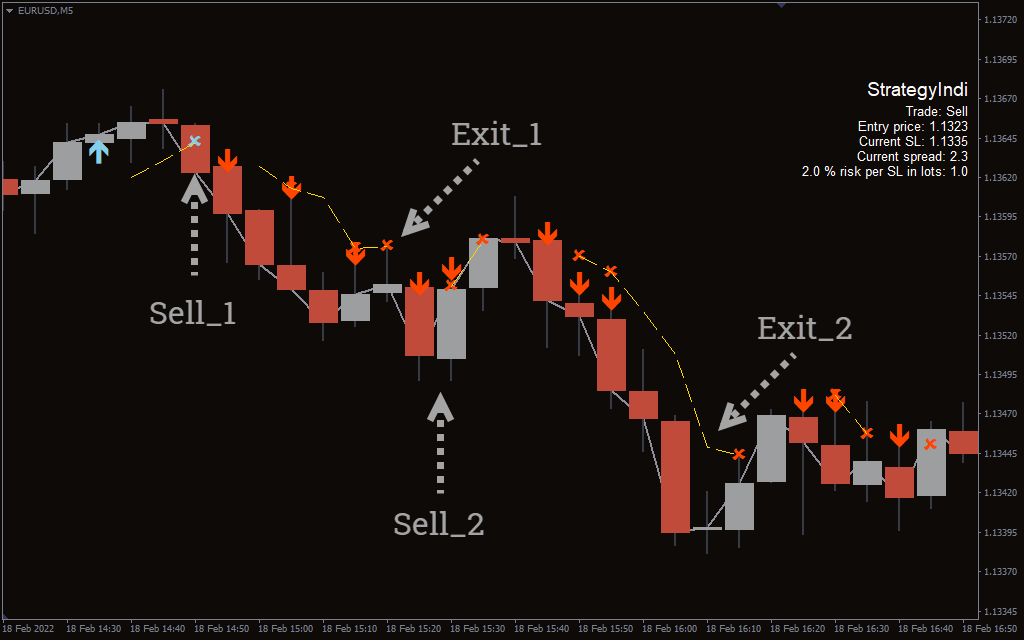
The Sell_1 marker points to the bar at the close of which a sell signal is received. The moving averages indicate that the market is turning bearish.
The Exit_1 marker points to the bar on which a protective stop-loss was triggered. The result of the trade is a small loss.
However, on the next bar there is a second signal to sell (Sell_2 marker). This short position yields a significant profit, as shown by Exit_2.
Conclusion
The Forex Strategy Indicator for Metatrader 4 helps you to trade with the trend and limit your risk.
The indicator uses moving averages and the Chandelier technical Indicator to auto identify buy/sell and exit signals.
Advantages of the Forex Strategy Indicator:
- easy to understand;
- helps to manage the risks;
- allows you to benefit from large trends;
- contains alerts;
- it can be used by investors on daily and weekly price charts.
Disadvantages:
- Too many false signals. They come when there is no clear trend in the market.
Be aware, the Forex Strategy Indicator can gradually destroy your account if the market is flat and you open trades on all the signals. Use additional filters/methods to increase your chances of making a profit.
Before risking any real money, train trading on a demo account with a preferable forex broker.
Download the Forex Strategy Indicator for MT4 for Free Now!