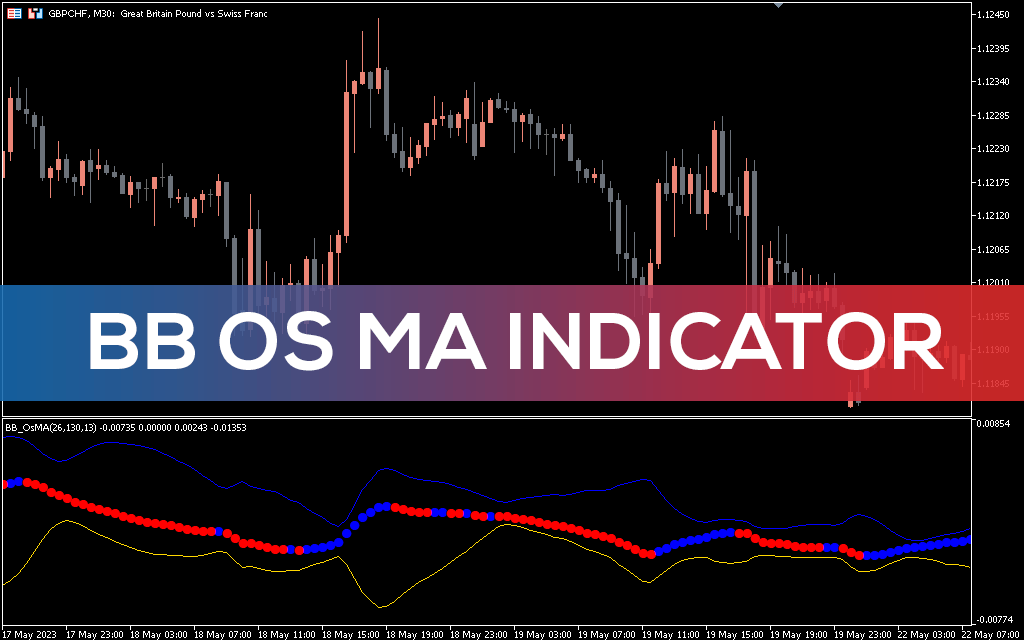
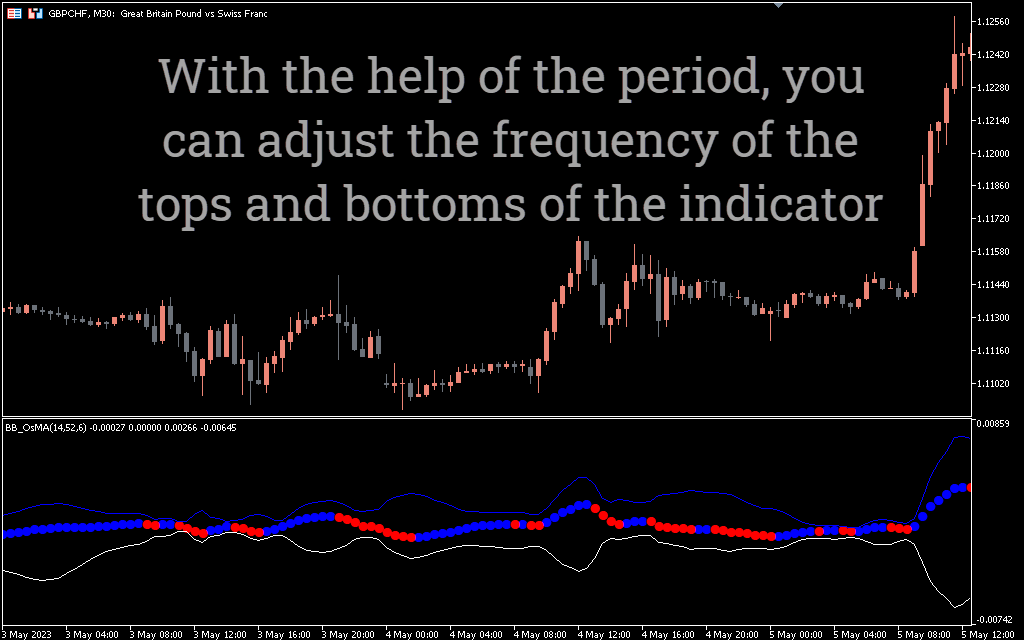
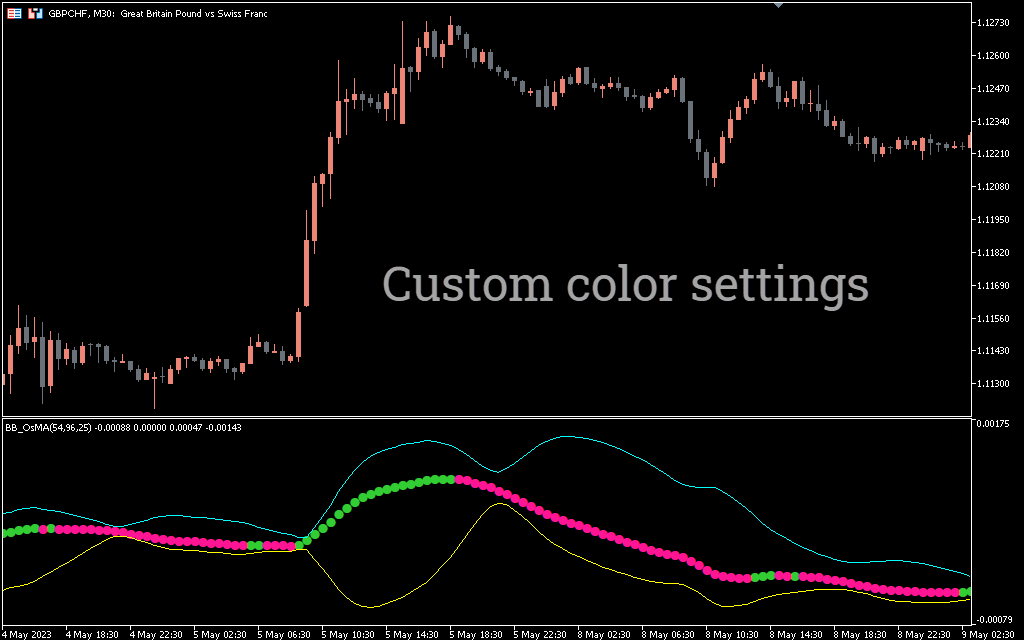
BB OS MA Indicator
BB OS MA Indicator spots potential price breakout & trend reversals in MT5. Suits any trend-following trading strategy
Description
The BB OS MA indicator is an MT5 technical analysis tool widely used by traders to identify market trends and potential buy/sell signals.
This indicator is most admired by day and intraday traders as it takes more into account recent price movement changes and provides real-time trend signals.
In this article, we’ll take a closer look at BB OSMA, how it works, and how you can use it to improve your trading strategy.
How to Spot Buy-Sell Signals Using the BB OS MA Indicator in MT5
The BB OSMA indicator is a derivative of the Moving Average Convergence Divergence (MACD) indicator. It is designed to track market dynamics and identify potential trend changes.
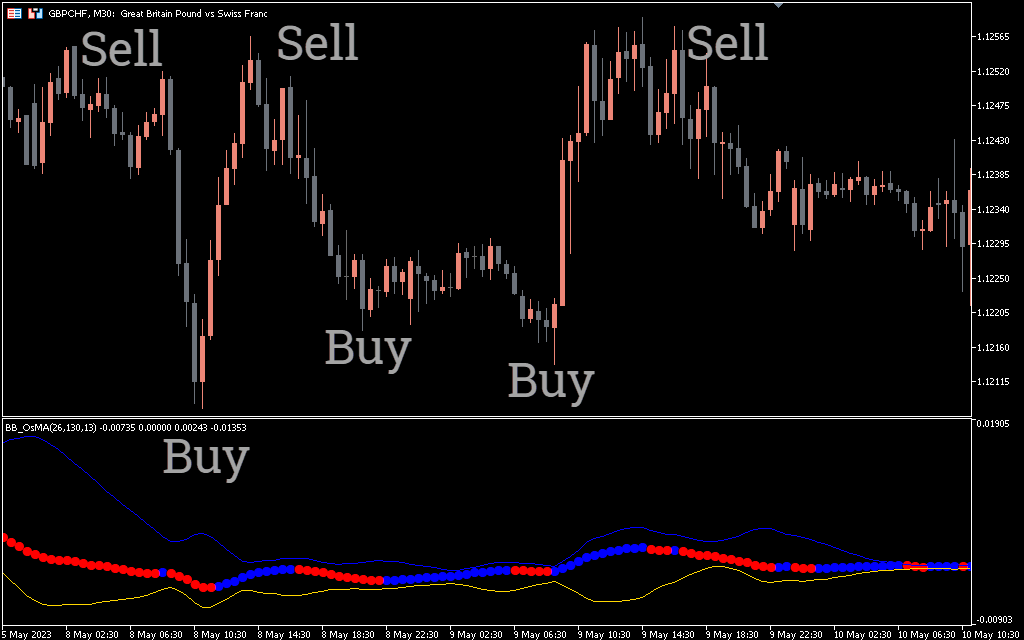
The indicator value is calculated by subtracting the 26 EMA from the 13 EMA. The result is then displayed as a histogram, with positive values indicating bullish momentum and negative values indicating bearish momentum.
In the example above, the GBP/CHF pair has formed a bearish breakout of the triangle pattern. Meanwhile, the BB OS MA level turned red and fell from the upper band, confirming a sell entry. Conversely, enter long when the dotted line is white and bounces off the lower band while price is forming a bullish breakout.
Conclusion
The indicator is simply the best tool for identifying market trends and potential buy/sell signals in all trading sessions. Traders can use it in MetaTrader in a variety of ways, including trend identification, divergence analysis, and buy/sell signals. It also smoothly adapts to any trading strategy and works as a filter for trading signals. If you want to improve your overall trading accuracy, consider adding the BB OS MA indicator to your MT5 toolbox.