
Bands Fibo True Indicator
Bands Fibo True Indicator For MT4 replaces the standard deviation-based Bollinger bands with Fibo-based ratios. Effective forex reversal trading indicator
The indicator works on the Bollinger bands trading rules. So, new forex traders should familiarize themselves with the rules before beginning to trade. However, advanced traders can trade these indicators in confluence with others. Additionally, Bollinger bands are suitable for automated trading strategies.
Bands Fibo True Indicator For MT4 Trading Signals
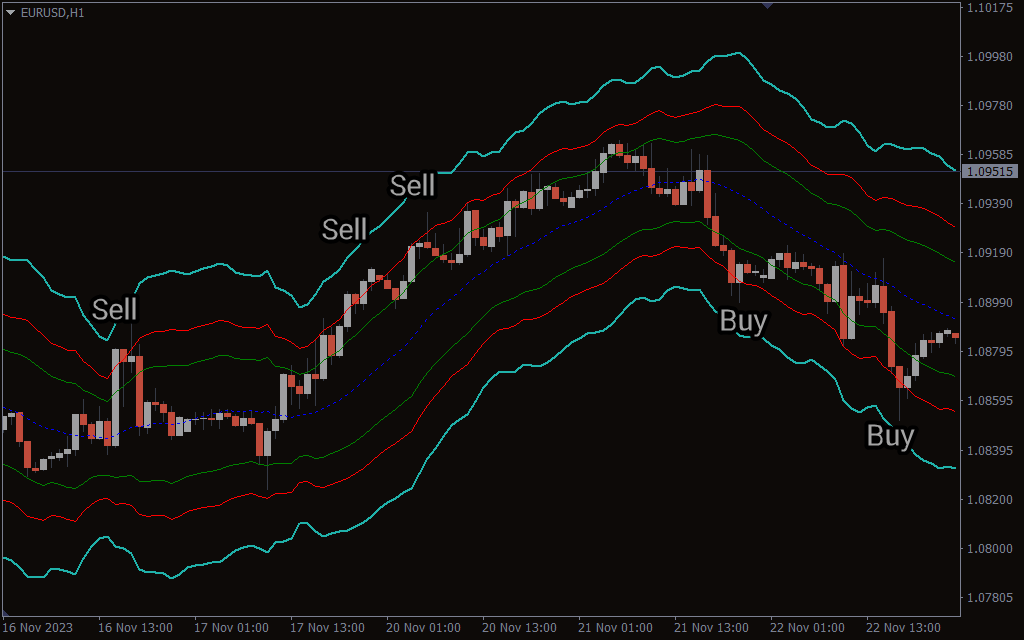
The indicator plots three upper bands and three lower bands. Outer Upper and lower light green bands correspond to 4.236, mid red bands are 2.618 and the inner green bands are 1.618 Fibo levels. The trading strategy is to enter the markets if the price touches the extreme outer band or mid band and reverses beyond the inner band.
If the price moves higher and hits the extreme outer band or mid band it is considered as overbought. Traders anticipate a price reversal, for confirmation price should reverse and close below the inner band to open a sell trade. It is essential to place a stop loss above the previous swing high and target the opposite band to book profits.
A similar trading strategy can be used in case of a bullish reversal. Traders can apply the same stop loss and profit strategy for this buy trade.
Conclusion
In summary, the Bands Fibo True indicator for MT4 is a different version of the classic forex Bollinger bands indicator. It replaces the standard deviation and uses Fibo levels instead for band calculation.