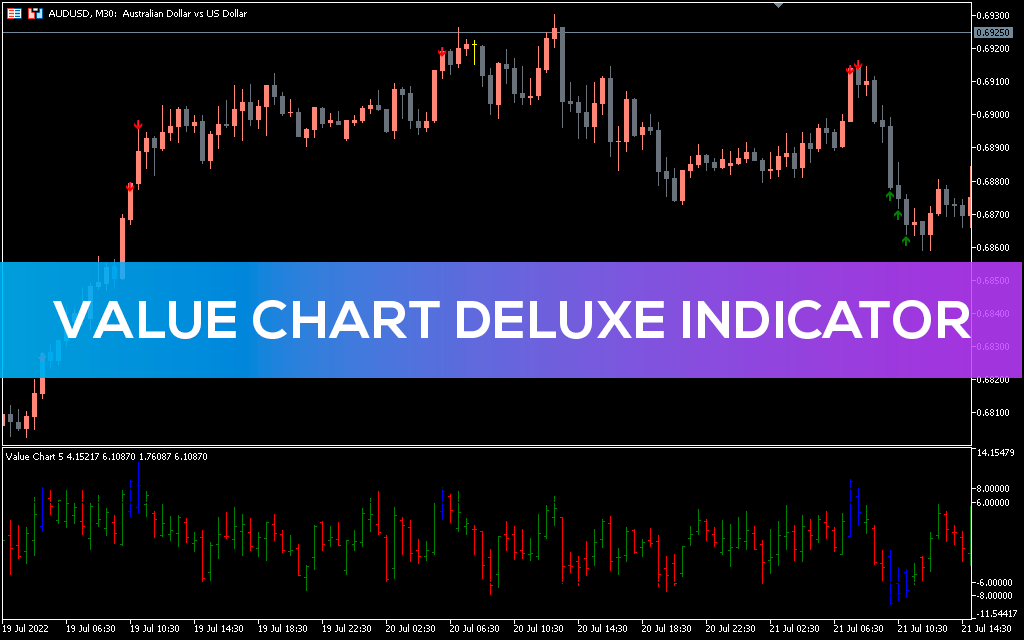
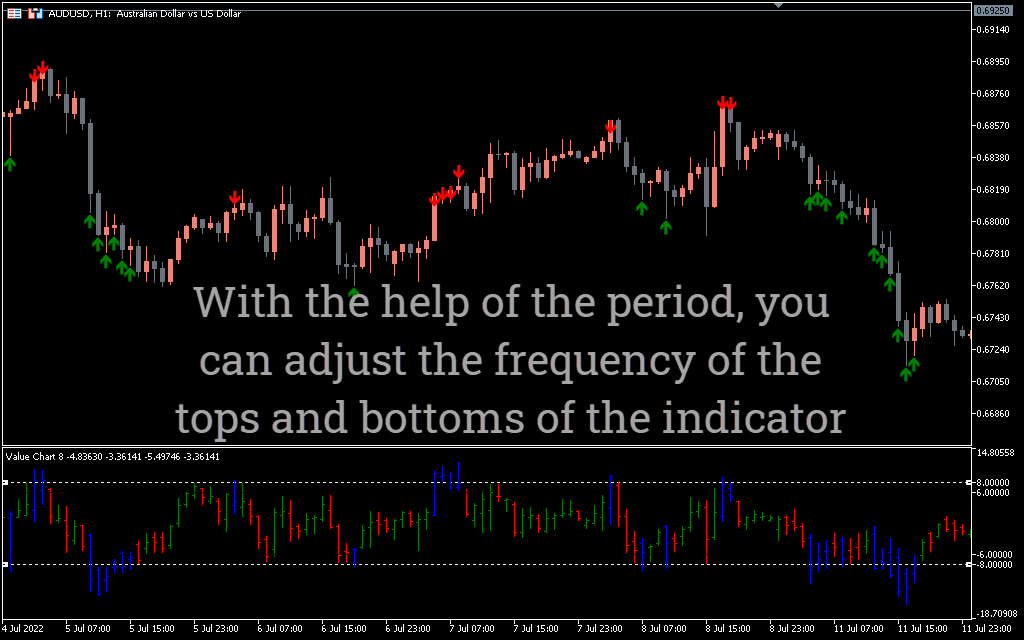
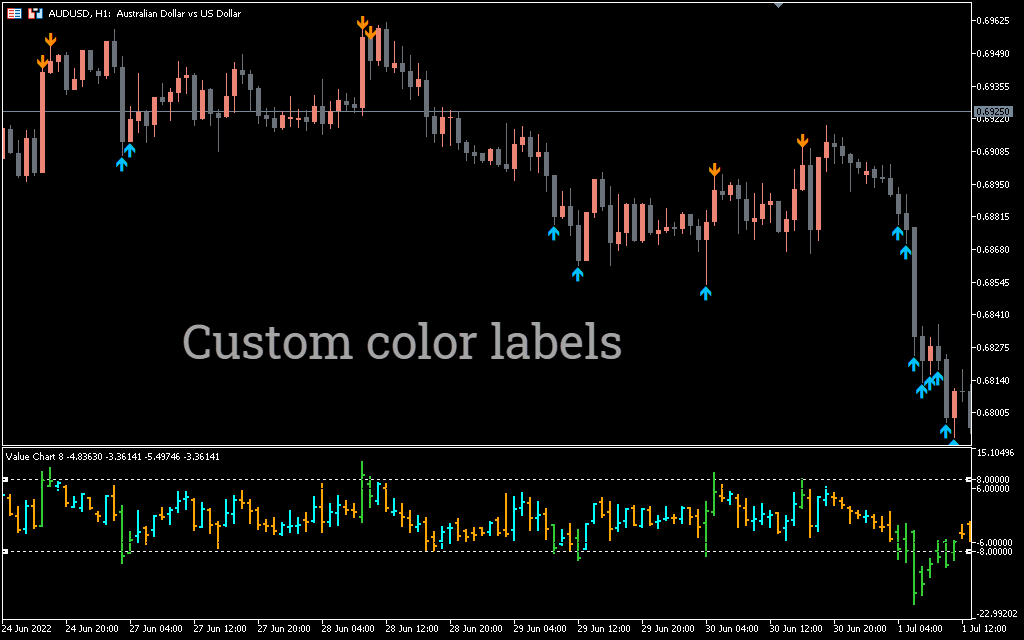
Value Charts Indicator
Value Charts Indicator for MT5 is a trend reversal indicator. Best support and resistance indicator. Divergence detector for MT5.
Description
The Value Charts Indicator for MetaTrader is a Forex trading tool that helps you identify continuous market cycles. The indicator does this by identifying highs/lows in price action, which helps you identify BUY/SELL zones.
The MT5 indicator visualizes major price reversal points to show where the market value is. It analyzes the current state of the market and varies it with the help of previously accumulated data on price behavior.
In addition to identifying overbought/oversold price areas, the Value Charts indicator can be easily used to identify support/resistance and divergence levels. Thus, the indicator is useful for identifying reversal zones.
This technical indicator will be useful for beginner traders as they can easily identify areas of interest in the market. Experienced traders can also use it as an additional confirmation to enter a trade, which is good practice in Forex trading.
How To Trade With The Value Charts Indicator For MT5
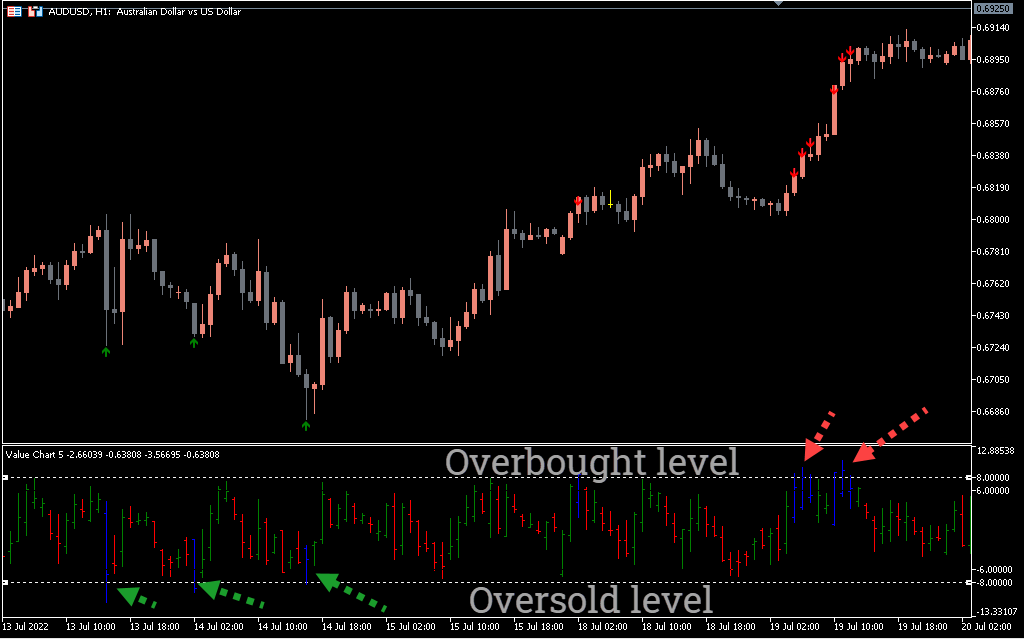
The image above shows how the Value Charts indicator will look on your chart once installed. The indicator is recommended to be used in conjunction with your usual trading strategy/indicators and not in isolation.
BUY Signal: First, wait for price movement or other trading indicators to suggest a possible bullish move. BUY/LONG if the candlestick in the Value Charts subwindow is also in contact with the oversold area.
SELL Signal: The same principle applies here. Wait until the price or other trading indicators are ready to move down. SELL/SHORT, if the candlestick in the Value Charts subwindow also touches the overbought level.
Conclusion
The Value Indicator for MT5 helps you identify and exploit extremes in market price movements. In addition, the indicator does not cost a penny – you can download it for free!