TMA Indicator
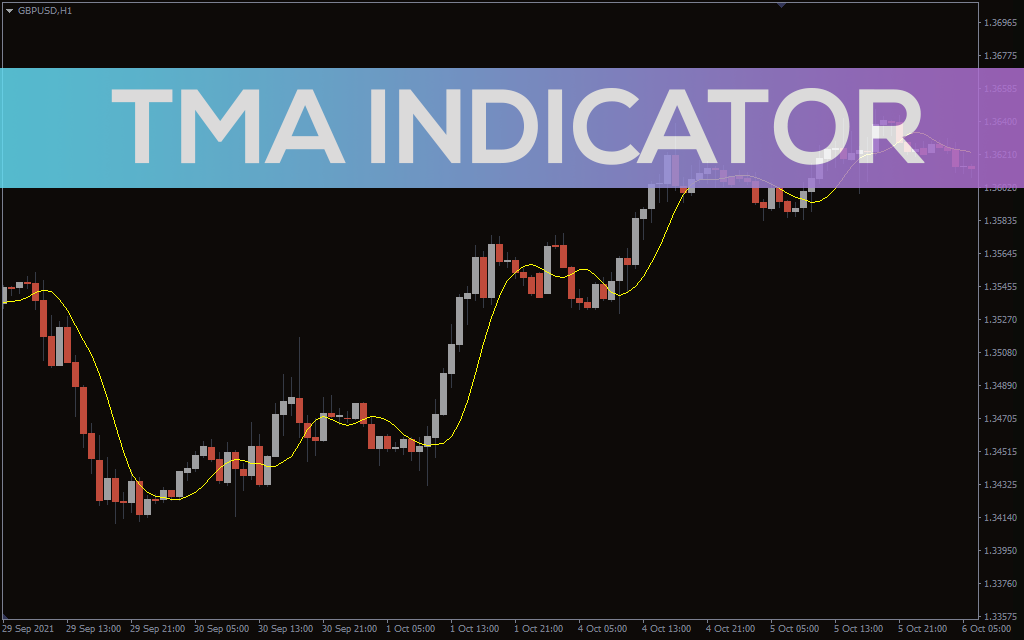
The TMA indicator draws a moving average on the chart and shows the overall course of the trend.
Description
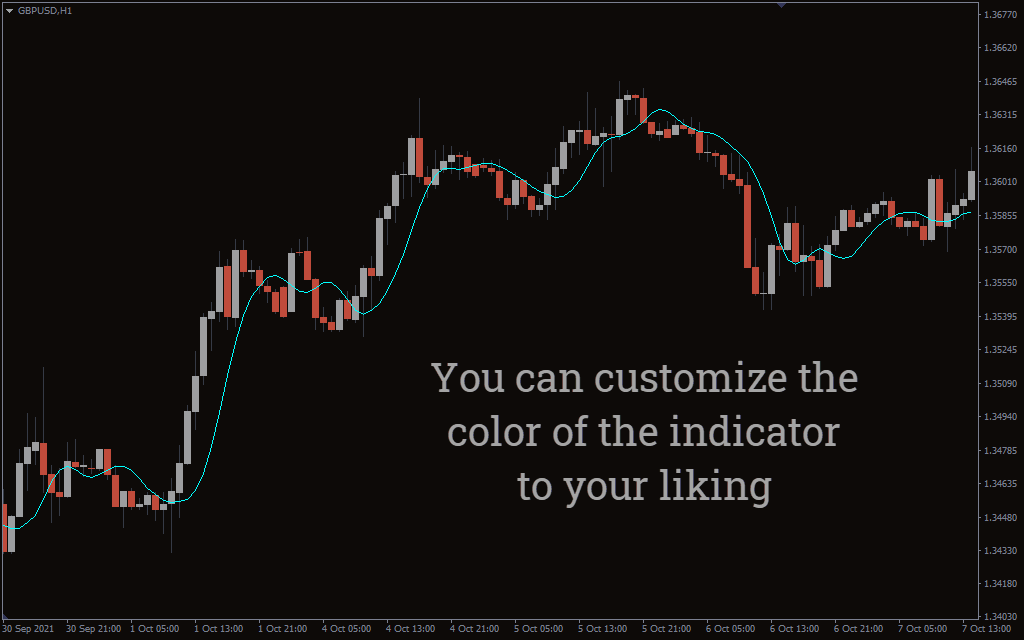
The TMA or triangular moving average is a simple MT4 indicator that draws one moving average on the chart.
The indicator focuses on the price action and presents the direction of the trend. When the TMA is below the price, it suggests an upward trend. Conversely, when the indicator is above the price, it signals a downward trend.
Consider Triangular Moving Average indicator like a normal moving average. Like the traditional MA, you can apply any other indicator with the TMA to get more accurate info.
The indicator gets the name triangular because of its structure. It forms a triangular wave-like structure to tell the direction of the trend.
How to trade the TMA indicator?
The TMA works like a traditional moving average, so you need to take it as a trend-following indicator to trade with it. The good thing about trend-following indicators is that they can give exact buying and selling points.
As mentioned earlier, the indicator follows the course of price. Therefore, when the price is above the TMA, it is upward, and you should enter long.
On the other side, when the price is below Triangular Moving Average, it indicates a downward trend, and you should enter short.
The indicator is useful because you can easily navigate the course of price action. You can then decide on when to go in and out of trade.
Generally, moving averages indicators work best with oscillators like the RSI or MACD. So, you need to combine the Triangular MA with them to reduce market noise.
Let’s find out the buy and sell strategy for the indicator:
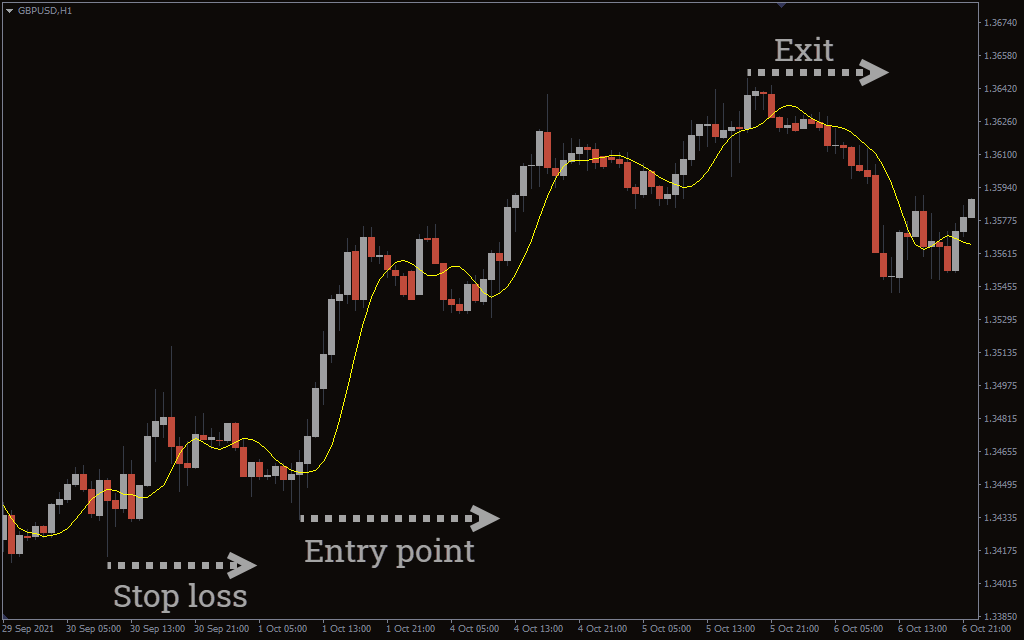
Triangular Moving Average indicator buy strategy
- TMA indicator should be below the price action.
- Wait for the price to fully cross the TMA from below.
- Enter the trade when the price goes above the indicator.
- Put a stop-loss near the low of a buying point.
- Exit the trade when the price dips below the TMA.
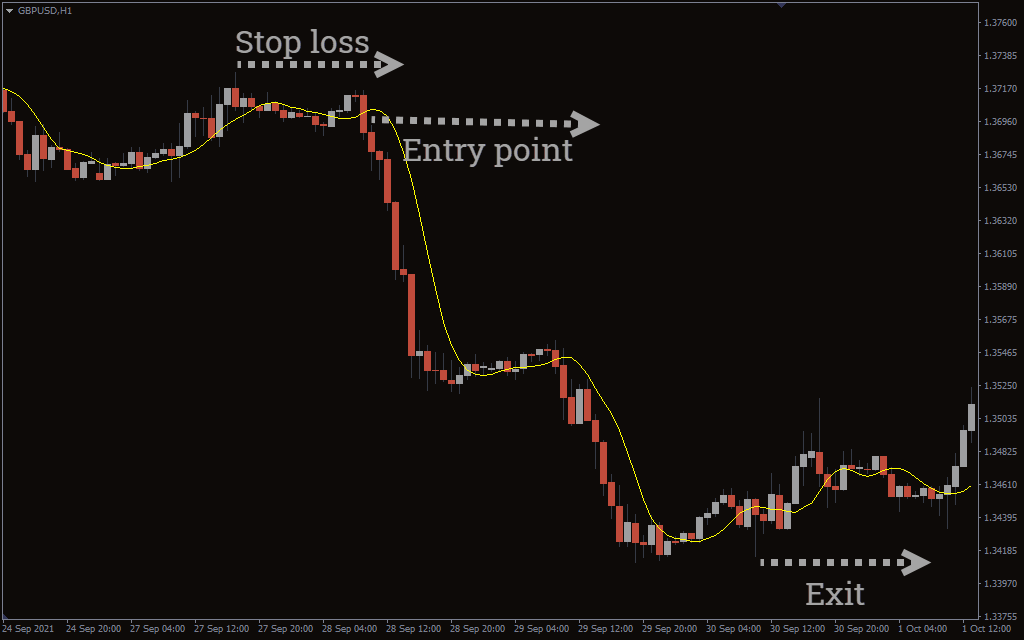
Triangular Moving Average indicator sell strategy
- TMA indicator should be above the price action.
- Wait for the price to fully cross the TMA from above.
- Enter the trade when the price goes below the indicator.
- Put a stop-loss near the high of a selling point.
- Exit the trade when the price goes above the Triangular Moving Average.
Conclusion
Triangular Moving Averageis a must-have indicator when you are a trend trader as it tells you the direction of the underlying trend.
You can apply the TMA indicator on any timeframe as it is a trend-following indicator. You can also combine the indicator with other forms of technical analysis like chart patterns and oscillators like the RSI or Stochastics.