RSI Candles Indicator
The RSI Candles indicator for MT5 automates the display of the RSI value on candles.
Description
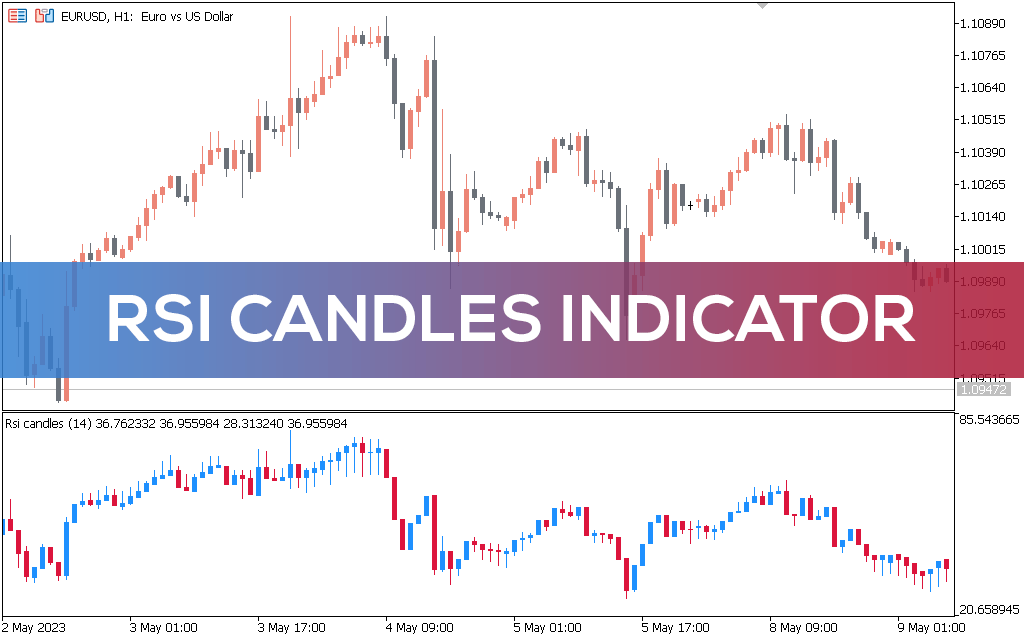
The RSI Candles indicator for MetaTrader 5 is a financial trading tool that automatically displays the value of the relative strength index on candles. This means that the RSI indicator itself will not be visible on the chart; rather, its value will be displayed on each candle.
In addition, unlike the regular RSI indicator, which is used to determine the direction of the trend and extreme price zones, the RSI Candles indicator is intended only to determine the direction of the trend.
Thus, this indicator only shows the bullish and bearish sentiment of the asset.
How do you read the RSI candles?
The RSI Candles indicator works around the level 50 of the RSI value. Typically, the RSI is bullish when it rises above the 50.00 level, and bearish when it falls below the 50.00 level.
Therefore, the indicator changes the color of the current bar corresponding to the current candle to blue when the RSI value is above the 50.00 level. Conversely, the indicator turns the bar red when the RSI falls below the 50.00 level.
How to trade with the RSI Candles indicator for MT5
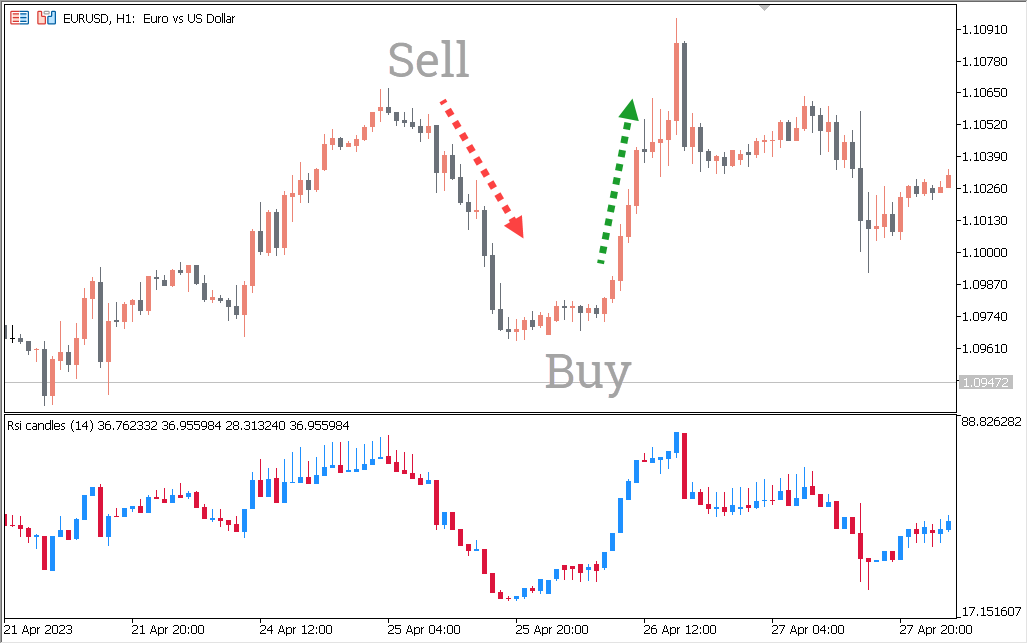
The above screenshot shows the trend analysis of the indicator on the EURUSD pair. Red bars indicate that the RSI value is below the 50.00 level, as explained earlier. Thus, the image shows that the RSI value is constantly below the 50 level, which indicates a strong bearish trend.
In addition, the indicator is recommended to be used in conjunction with price action/other technical trading tools, and not as a standalone indicator. So the image above shows how the price action was used along with the indicator to determine a sell opportunity.
Conclusion
The RSI Candles Indicator for MT5 is a forex indicator that displays bullish and bearish sentiment based on the value of the relative strength indicator.