MACD on Chart Indicator
Make the best buy/sell decisions for currencies and stocks with the Metatrader 5 charting MACD indicator. Signals market momentum, trend reversals and precise trading zones.
Description
The MACD on Chart Indicator is an automatic trend scanner that closely monitors changes in market momentum. As a rule, the moving average convergence-divergence indicator works in a separate window, signaling the state of momentum. However, the MACD on the Chart indicator shows trend and momentum conditions in the main chart window.
This indicator is the easiest to understand and trade, it just draws signal arrows. As such, it greatly helps traders anticipate accurate buy/sell opportunities.
Our detailed review shows that the MACD indicator on the chart is well suited for all types of trading instruments, including forex and stocks. In addition, it is suitable for MTF trend and momentum analysis on MT5 platforms. This guide explains how to use the MACD indicator on a chart in MT5 to identify potential buy/sell signals, including sample charts.
How to trade forex and stocks with the MACD indicator on a chart in MT5
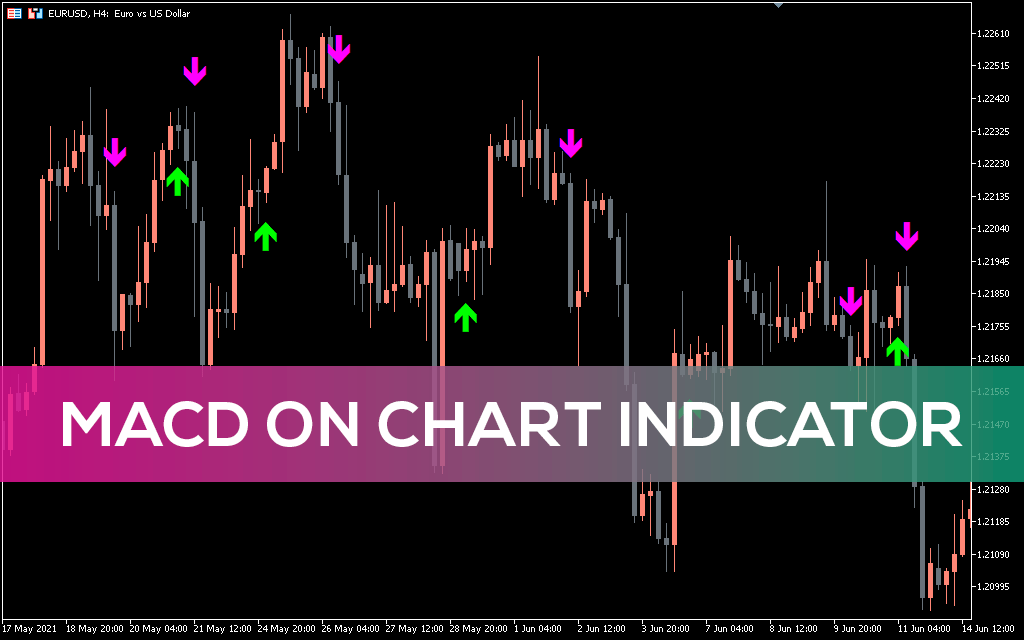
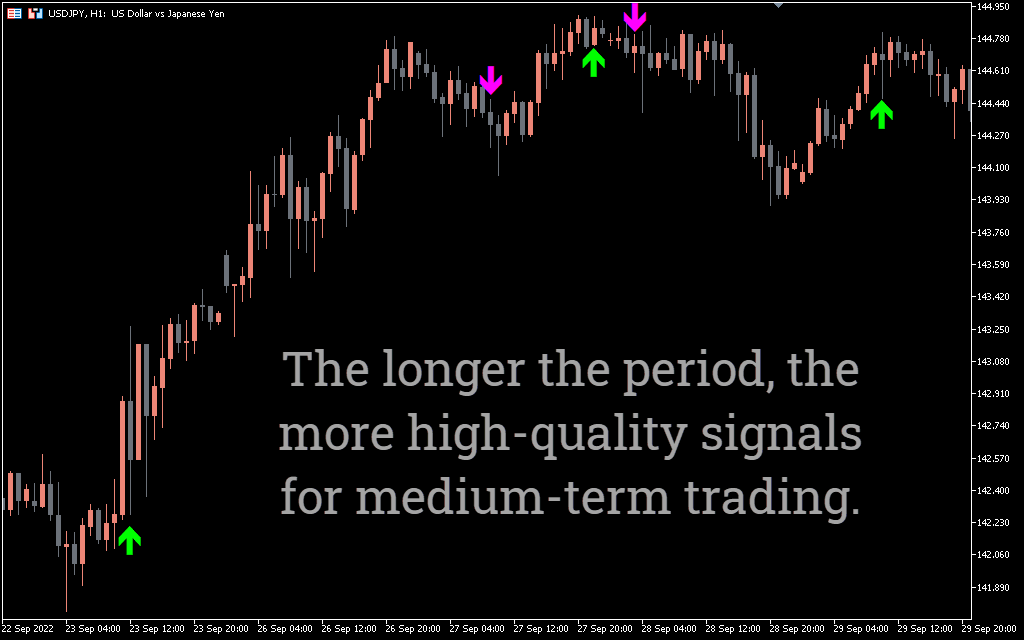
Fortunately, this indicator will not force you to look for intersections of various lines, as its older brother from Metatrader 4 did. In the new version, the indicator will do everything for you and show ready-made signals in the form of large arrows on the price chart.
Green arrows are directed upwards, which means they indicate a trend change and a potential buy signal. On the contrary, purple arrows pointing down means a trend change to bullish and a subsequent short trade.
So, as soon as you see the newly drawn arrow, wait for a price move or other confirmation of action before entering a trade.
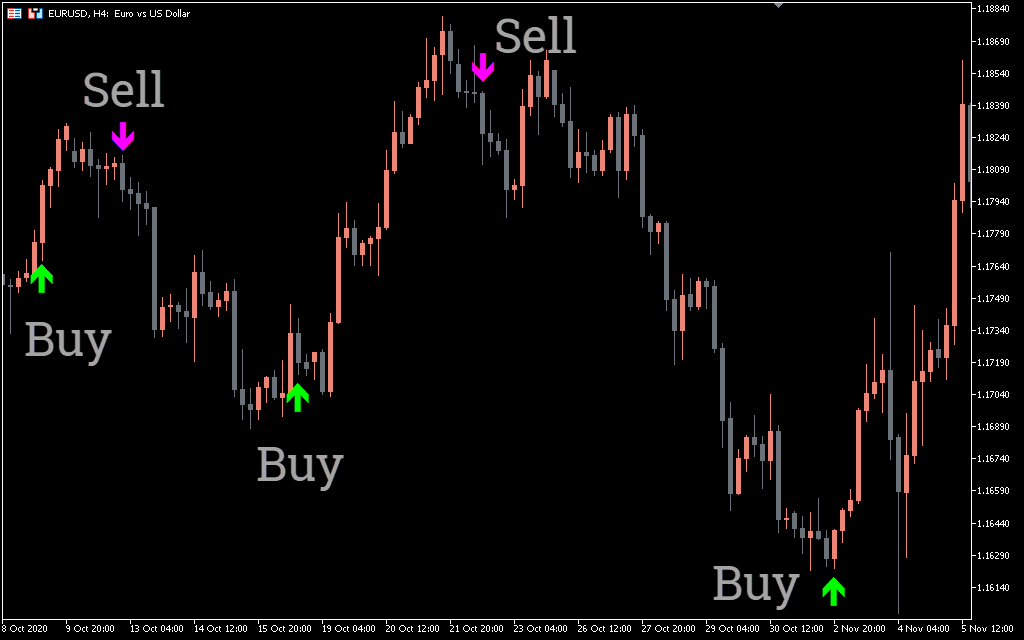
In the EUR/USD example above, you can clearly see that after the green arrow appeared, the price moved up with small bounces. According to the MACD on Chart trading strategy, this is the ideal setup for opening long positions. If you go long, consider exiting after the indicator draws a new arrow.
Conversely, go short when you see the purple arrow and the price starts moving down. Alternatively, you may decide to exit your short position as soon as the green arrow appears.
Conclusion
The MACD indicator on the chart follows a dynamic process of identifying trend-following buy/sell signals. In addition, it takes into account many technical factors such as EMA, MACD line and crossover signals to filter trading signals. These features help traders avoid weak trades and pick the best opportunities with higher success rates. In addition to beginners, advanced traders will also find the MACD on the Chart Indicator to be a useful tool for more accurate analysis of market momentum and trend conditions.