EMA Indicator
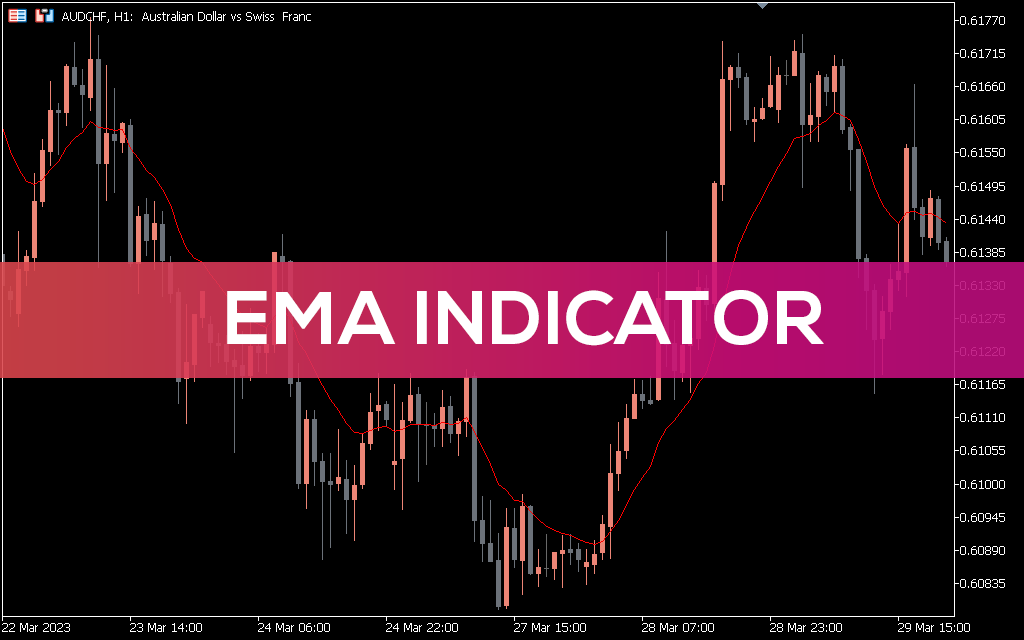
MT5Also Available for MT4An incredible market trend detector is the EMA indicator. An ideal forex indicator to determine the direction of the trend and track the price movement of various currency pairs.
Description
Moving averages (MA) are one of the handy tools for forex traders. They show the price change over a certain period. It is worth noting that there are four types of MAs, including EMAs. Exponential moving averages (EMAs) give more weight to recent prices. This means that it is more responsive to recent price changes than simple moving averages. In addition, the EMA indicator for free download in MT5 determines the price change quite early. However, it undergoes more changes in a short time.
Trading using the EMA indicator
There are several ways to use the EMA indicator.
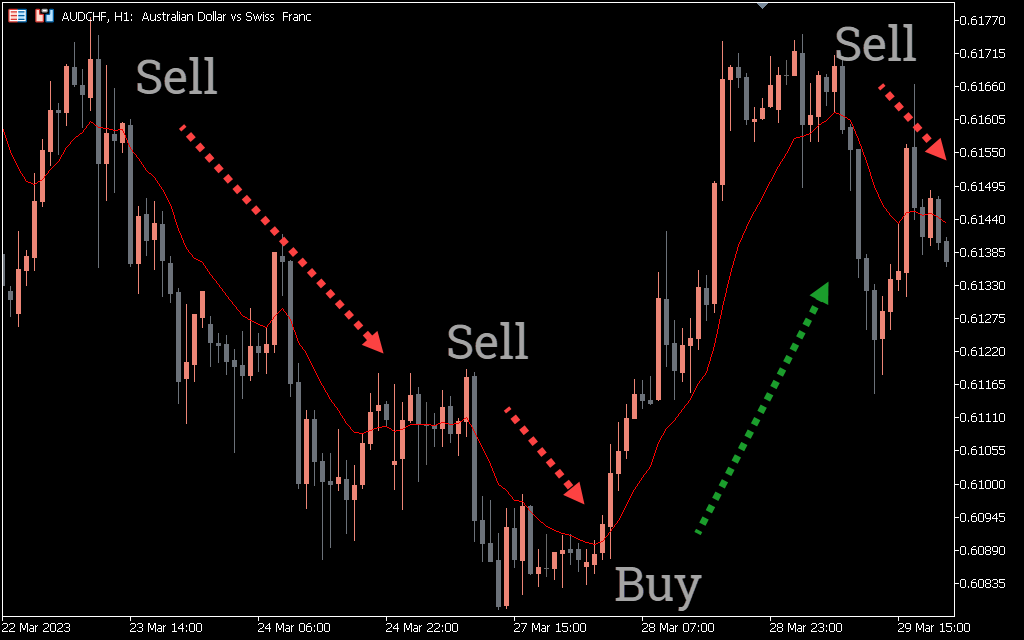
Typically, a rising EMA represents a bullish market, while a falling EMA indicates a bearish price move. This means that you should go short when the EMA is falling and go long when the EMA is rising.
You also need to look at the position of the EMA to understand the overall market trend. When price trends move above the exponential moving average line, it is a clear sign that an uptrend is in place. Similarly, if the price is below the EMA line, it indicates that the market is in a downtrend.
Crossover Strategy
The crossover strategy gives the best buy and sell signals. Ideally, this strategy involves the use of fast and slow EMAs, usually 9-period and 21-period EMAs.
A buy signal is generated when the shorter EMA crosses the longer period EMA from below. Similarly, when the shorter EMA crosses the longer EMA from top to bottom, it is interpreted as a sell signal.
Now, what is the exit strategy, you ask? Well, you can place the indicator on the recent low and place profits on the next high or resistance zone.
Triple EMA Strategy
With a triple EMA, the indicator gets better. It involves using three different periods to generate the best signals. For example, you can use the 5, 15 and 200 EMA periods. For buy signals, the price should trade above the 200 EMA line. Then wait five EMAs to insert the 15 EMA line.
Chart Example
The picture above shows the price chart of the British Pound Sterling against the Australian Dollar. The blue line shown by the gray arrow represents the 5-period EMA. The red line shows the 15 period EMA and the green line shows the 200 period EMA.
Note that the price is trading above the 200 EMA. The indicator gives a buy signal when the blue line crosses the red line as indicated by the yellow circle. In fact, after the signal, the price continued the uptrend.
The ideal stop loss is below the recent low, just below the breakout pattern. The long (200) period EMA also acts as a great stop loss. For an exit strategy, you can use a risk to reward ratio of 1:3. The next resistance area also acts as a good take profit area.
Closing word
The EMA indicator is a great indicator. Note that longer periods ensure that the market moves smoothly. However, it gives more false signals. On the other hand, shorter periods give more signals, albeit more false ones. Therefore, it is wise to use the indicator in combination with other tools in order to receive more reliable signals.