Cumulative Delta Indicator
An excellent cumulative delta indicator for buy and sell signals. The ideal trend detector for the MT5 platform.
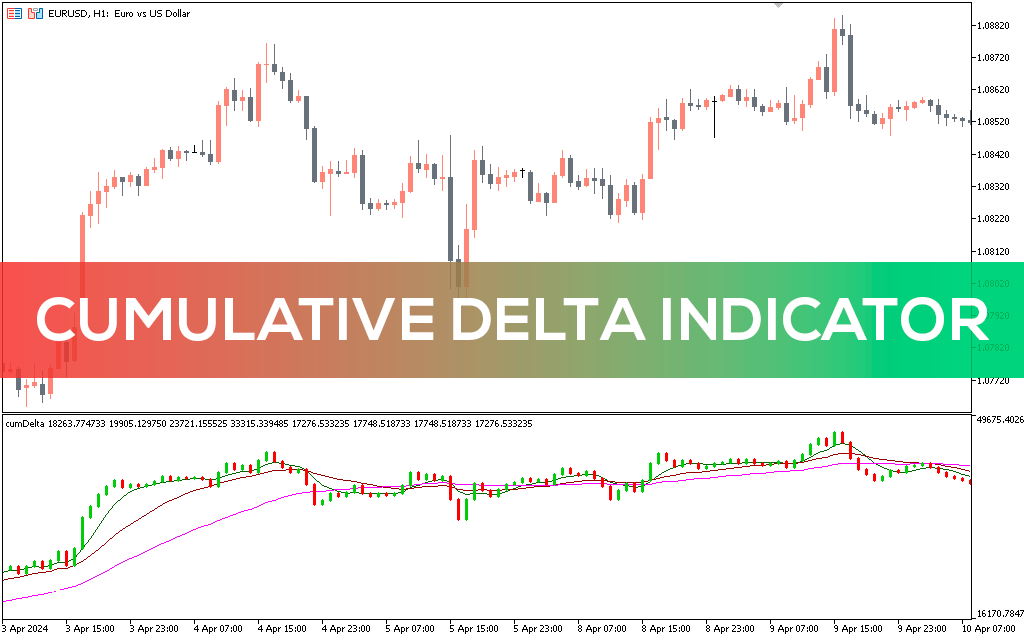
Essentially, delta is the difference between buyers and sellers. The indicator calculates the difference between buyers and sellers and displays the information as a bar in the window below the chart. The streak lengthens when there is high momentum in the market.
Interpreting the cumulative delta indicator is easy and simple. So, you can easily use it whether you are a beginner or experienced in trading. The indicator works well on all time frames, including daily, 1 hour and 15 minutes, and can be used to trade all instruments, including Forex currency pairs.
How to use the indicator for trading
As mentioned, the cumulative delta indicator shows the sum of delta bars by subtracting the volume of buyers from the volume of sellers. You can change the number of bars that will be included in the summation.
Buy signal
A buy signal occurs when the indicator displays a green bar. This means that in the market there are more buyers than sellers and they have the power to push the price higher. When the market is in an uptrend, you should open a long position.
Similarly, the indicator gives a sell signal when there are more sellers than buyers. Therefore, you should consider opening a short position. Massive bearish pressure is characterized by an extended red band.
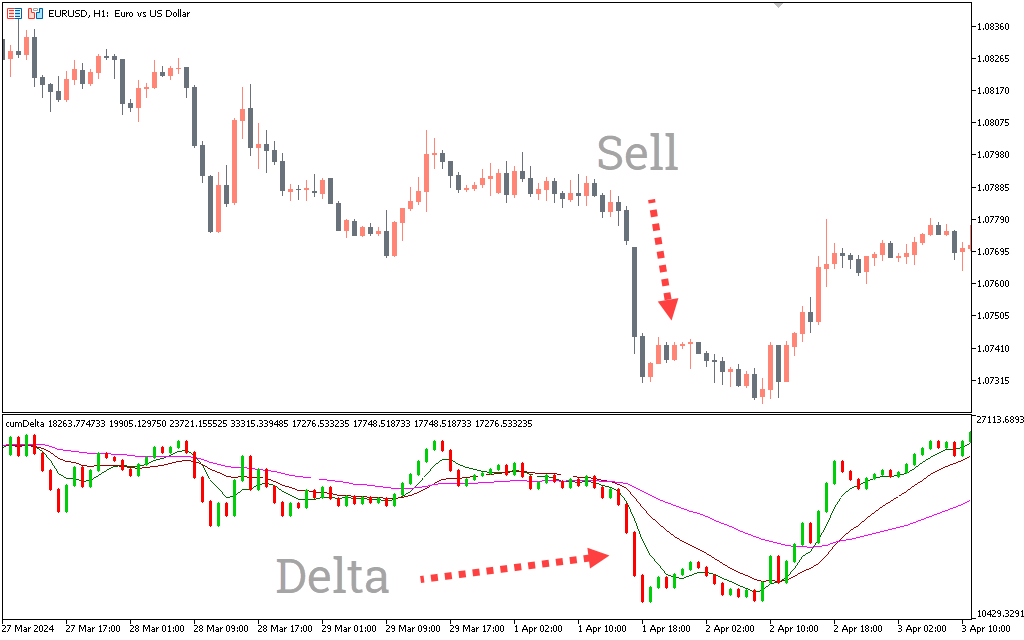
The price chart shows the price movement of the UK against the US dollar. The price is on a strong downward trajectory, which means sellers are pushing the price down. The indicator displays a massive red bar indicating that the price is falling. Therefore, you should open a short position.
Conclusion
The cumulative delta indicator shows whether buyers or sellers control the market. It obtains this information by calculating the difference between buyers and sellers. As a trader, this information will help you decide whether to buy or sell. Basically, you should sell when the market is in a downtrend and buy during a bull market. It is wise to use this indicator with other trading strategies and tools to achieve confluence and enhance positive results.