BBR RSI Oversold Overbought Indicator
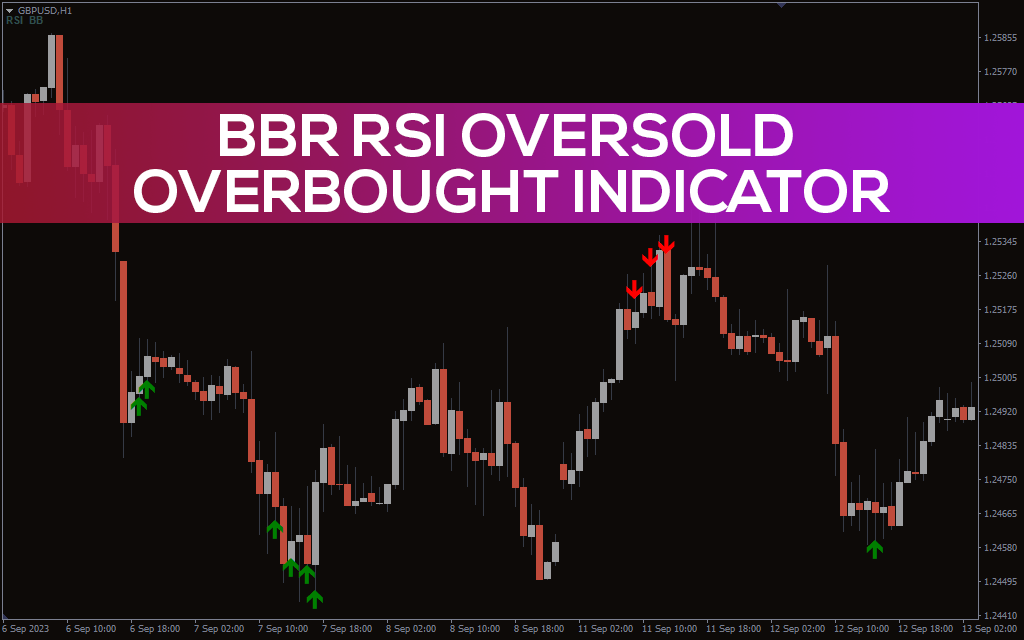
Easily spot market conditions with BBR RSI Oversold Overbought Indicator for MT4. Red and green arrows guide your trading decisions. Customize settings for your style.
Description
The Bollinger Bands Relative Strength Index (BBR RSI) is a custom indicator that combines Bollinger Bands and the Relative Strength Index (RSI) to help traders identify overbought and oversold conditions in the market. This indicator combines the abilities of both the RSI and the BBR to show overbought and oversold market conditions.
When the price hits the upper band of the BBR and moves in the overbought region of the RSI, the indicator shows a red arrow. If the price hits the lower band of the BBR and moves in the oversold region of the RSI, then the indicator shows a green arrow.
How To Use The BBR RSI Oversold Overbought Indicator For MT4
Following appropriate market momentums, the BBR RSI Overbought Oversold Indicator delivers extremely likely buy-sell recommendations. The relative strength index is applied in a special setup to forecast future price changes.
RSI is a momentum indicator that technical analysts use to determine whether a security’s price is overvalued or undervalued. It assesses the current price swings’ speed and amplitude. This indicator also provides information on oversold and overbought markets and price activity. It indicates assets ready for a price correction or a change in trend.
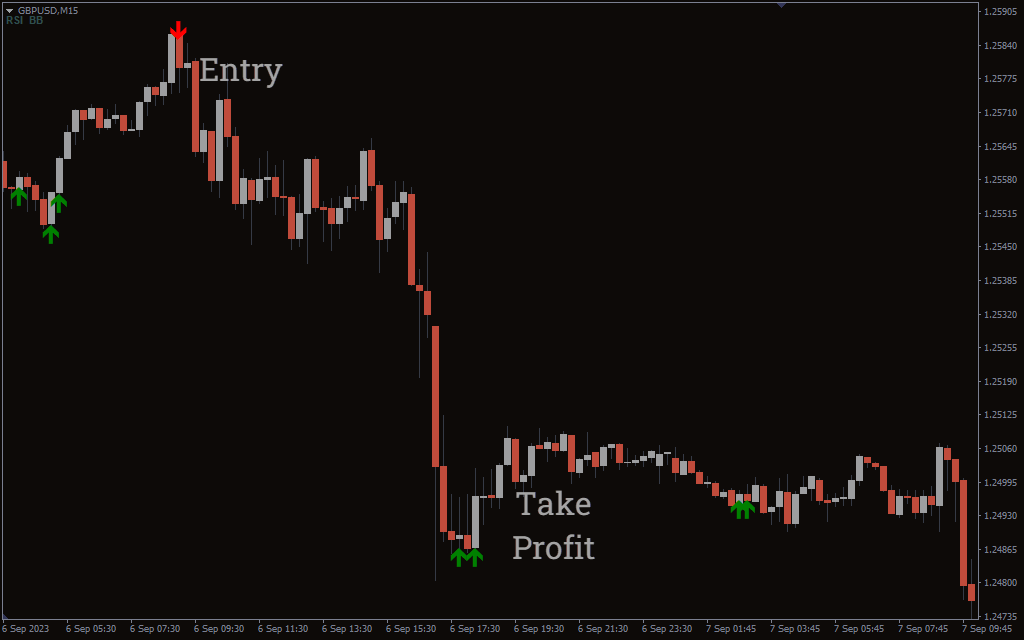
This indicator uses this principle to generate trading signals. When it shows a red arrow, the market is overbought so you can enter a short position.
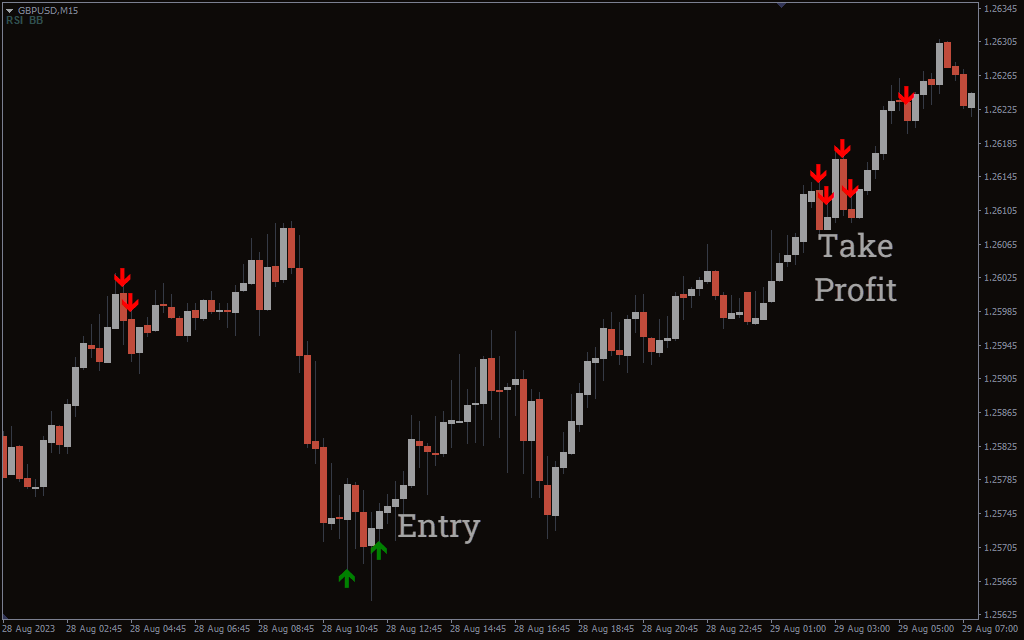
The market is oversold when it shows a green arrow, so you should enter a long position.
Conclusion
The Bollinger Bands Relative Strength Index combines Bollinger Bands and the Relative Strength indicator to help you identify overbought and oversold market conditions. The indicator gives entry signals by placing either red or green arrows on the chart.