WATR Indicator
WATR Indicator is a suitable technical indicator for identifying perfect trade entry points. An ideal tool for detecting trend reversal and identifying market direction.
Description
The weighted Average True Range Indicator (WATR) indicator is a simple MT4 indicator that shows the market trend and signals potential price changes. It is an enhanced version of the Average True Range Indicator. The indicator smooths the ATR by integrating a weighting factor.
The WATR indicator – download free focuses on the recent price changes and reacts quickly to changes in price action. It provides a trading signal that is simple that is easy for beginner traders to understand. What’s more, it can be used to trade all forex currency pairs on all timeframes on Metatrader 4.
How to Use the WATR Indicator
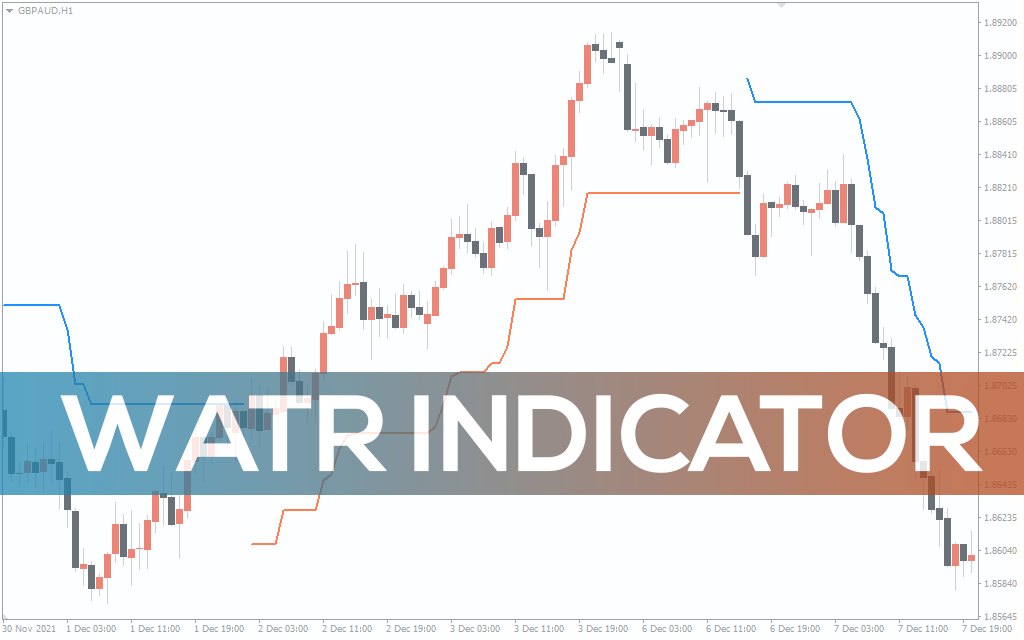
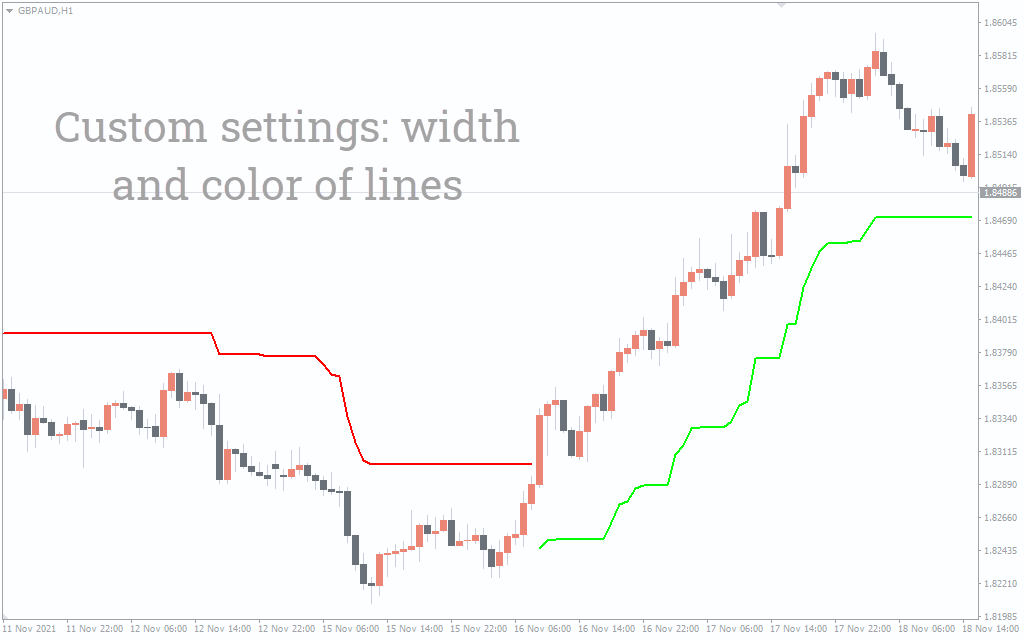
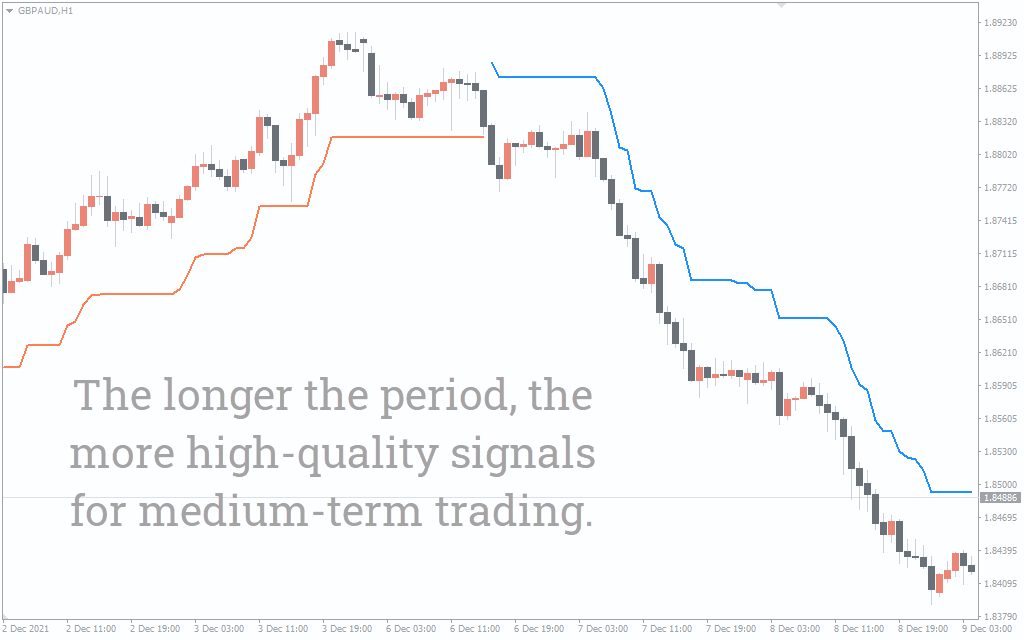
The technical indicator forms dodger blue and coral lines along the price depending on the price directions.
Buy Signal
A buy signal occurs when the coral line appears after an uninterrupted blue line. Wait for the candlestick on which the coral line appears to close. Ensure the candlestick closes above the previous blue line. In general, go long when the coral line appears with the candlesticks closing above the indicator line.
Sell Signal
A sell signal occurs when the indicator draws a blue line after the coral line ends. Wait for the candlestick to form below the coral line and close under the blue line. Go short when a dodger blue line appears, and candlestick closes.
Exit strategy
Close the trade when, during an uptrend, a blue line appears above the candlesticks, or a coral line appears below the candlesticks in a downtrend. This is a tell-tale sign that the price has reversed.
The indicator’s lines work perfectly as a trailing stop loss. The indicator allows you to tweak the parameters for enhanced signs. You can use the indicator as a standalone indicator or with other trend-based indicators for better signals. Take profits according to a 3:1 profit to loss ratio.
Chart Example
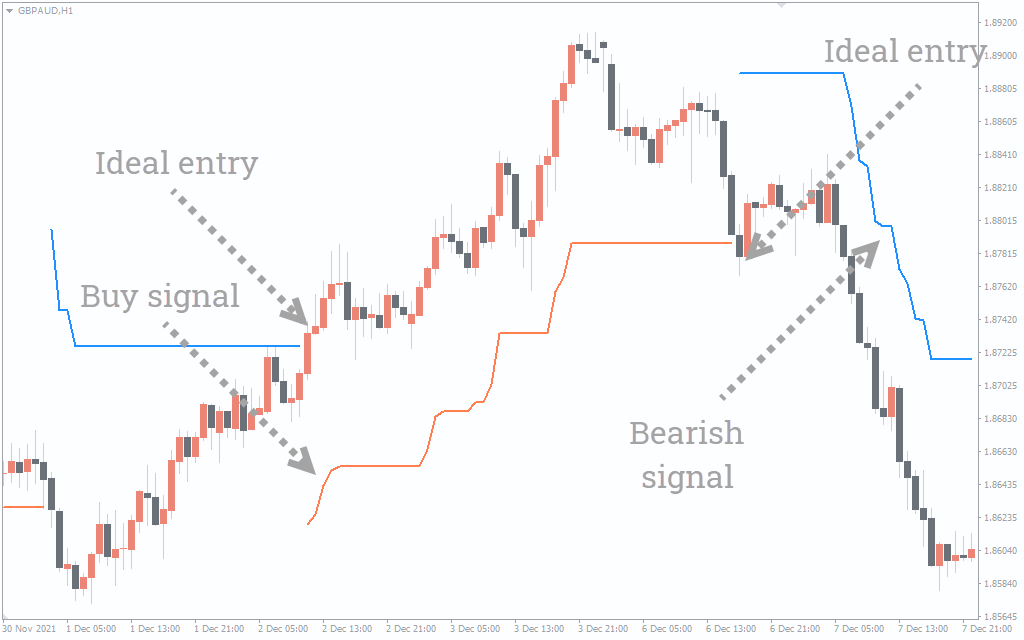
The chart above shows price movement for Great Britain against the Australian Dollar on a daily time frame. The indicator draws a coral line during an uptrend. In fact, the candlesticks close above the indicator line in the bullish market.
The indicator then forms a dodger blue line when the trend reverses from uptrend to downtrend. During the bearish move, the indicator draws a dodger blue line. The candlesticks close below the indicator lines make the indicator line an ideal stop-loss point.
Conclusion
The WATR Indicator is a simple but effective technical indicator. It does not require additional calculations and enables you to find good entry points quickly and easily. You can use it as a stand-alone indicator and combine it with price action and other technical tools to make well-informed trading decisions.