Color OSMA Indicator
The color OSMA is a suitable market trend and reversal detector. It is available freely for download.
Description
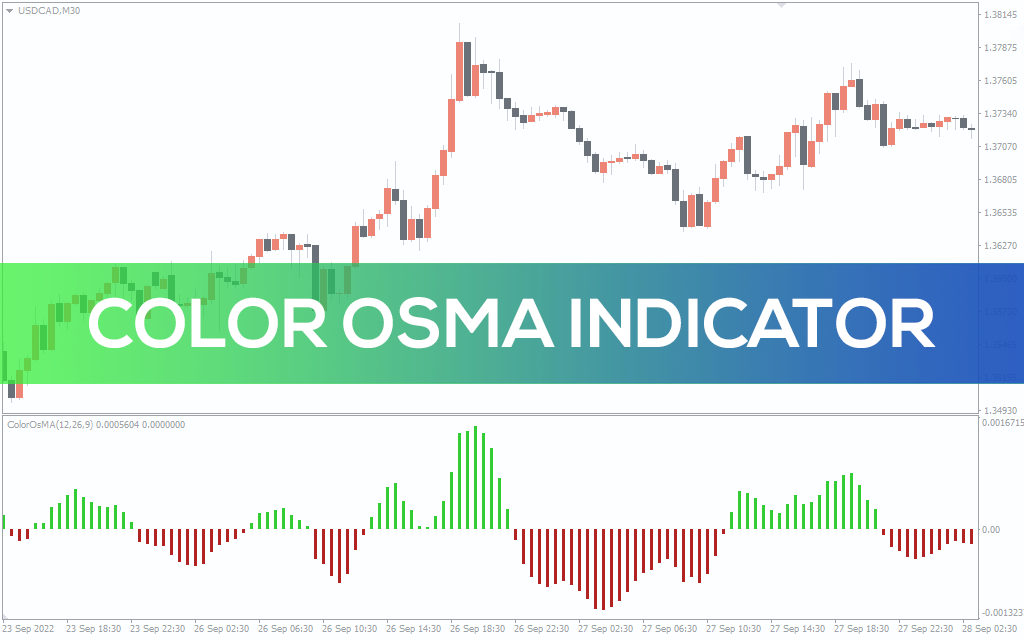
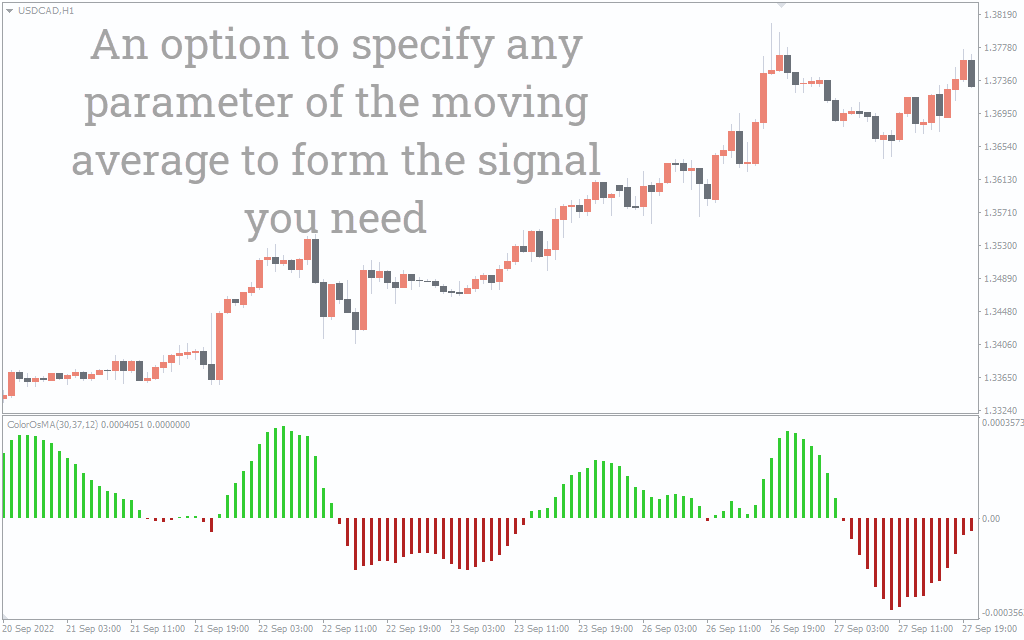
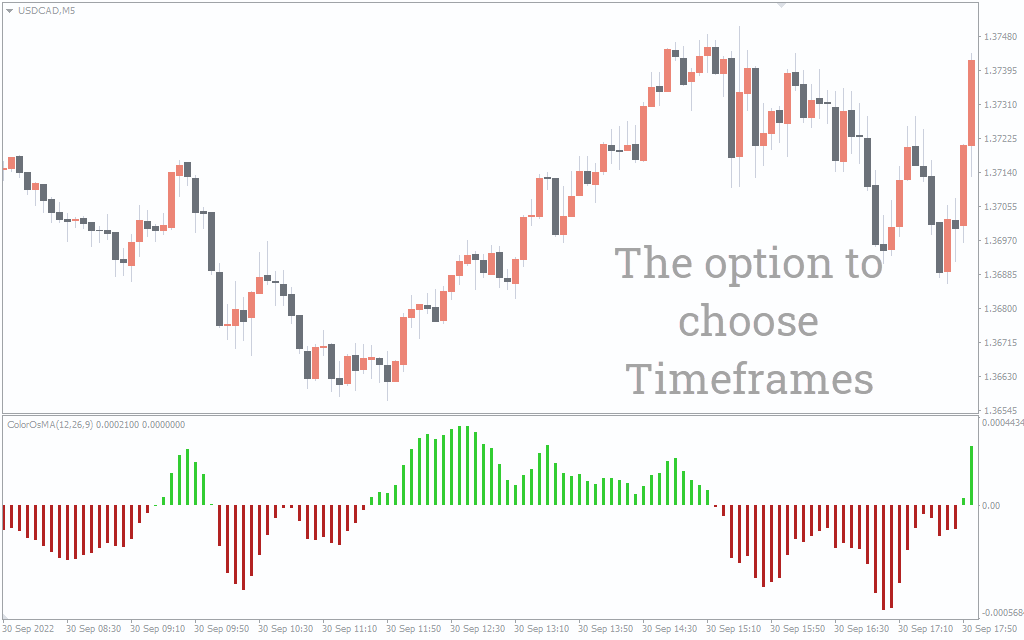
The color OSMA is a simple-to-use indicator that uses colored histograms. It is based on the oscillator of the moving average. You can use the indicator to trade any instrument in any timeframe. Color OSMA works well in any timeframe, and you can use it to trade any currency pair.
How it Works
Using the indicator is pretty much straightforward. It displays histograms akin to MACD in a separate window below the price action. Essentially, you will want to check two things. The bar position with respect to the zero line and the color of the bar graphs.
- Buy signal – The indicator gives a buy signal when the green bars form on the topside of the center line. Essentially, the longer the bar graph, the stronger the bullish momentum.
- Sell signal – The indicator gives a sell signal when the bars with fire brick, brownish color appear on the lower side of the center line. Essentially, when the bars are elongated to the downside, it means the bearish pressure is high.
Color OSMA Trading Example
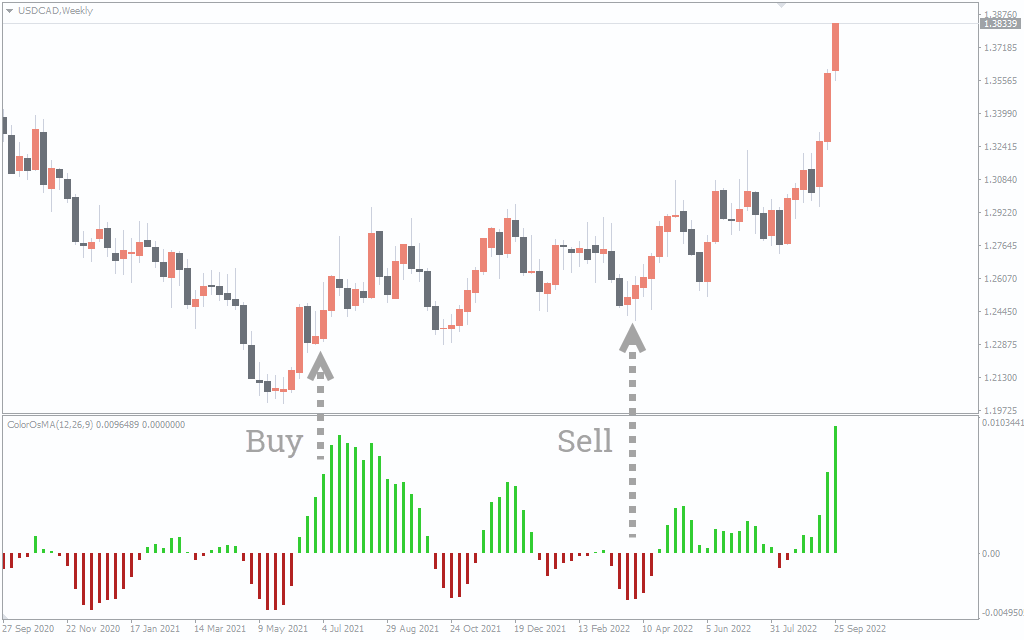
The picture shows the price action for the EUR/USD weekly timeframe. The indicator posts green bars when the charts start to rise. This is an indication of a buy signal. Therefore you might want to open a long position. When the bars start shortening, indicating that the momentum is dwindling.
The downtrend mentum picks up, and the indicator posts brownish bars. You, therefore, want to sell and ride the downtrend.
Conclusion
The color OSMA uses an oscillator of the moving average. You can use the color of the histogram to determine the market trend. It is an ideal tool for identifying the market direction and changing momentum.