

RSI MTF Indicator
Enhance your technical analysis with the RSI MTF Indicator for MT4, providing a multi-timeframe view of RSI values for comprehensive market insights.
Description
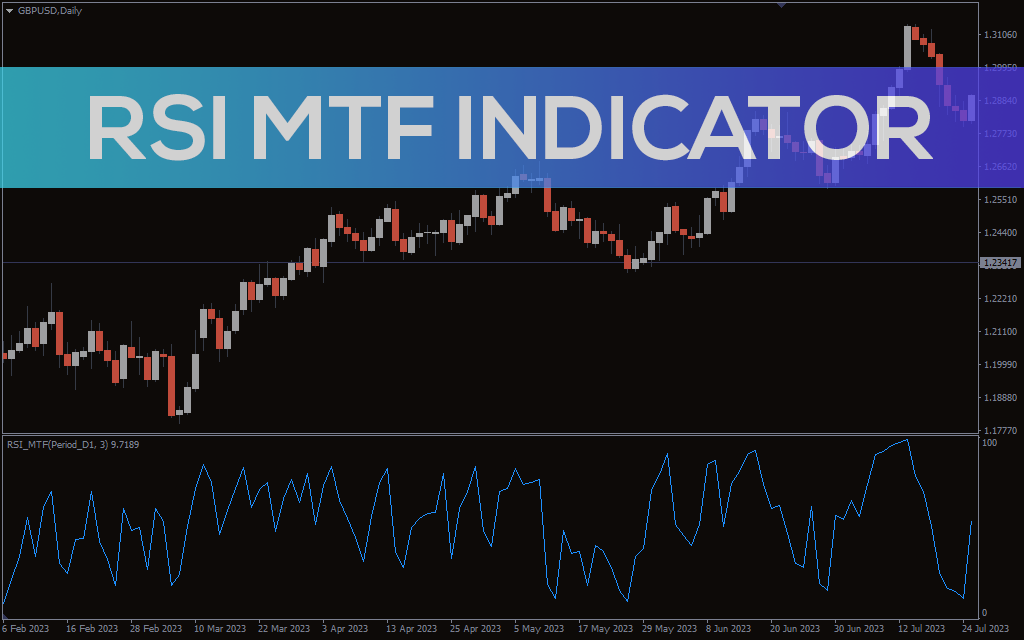
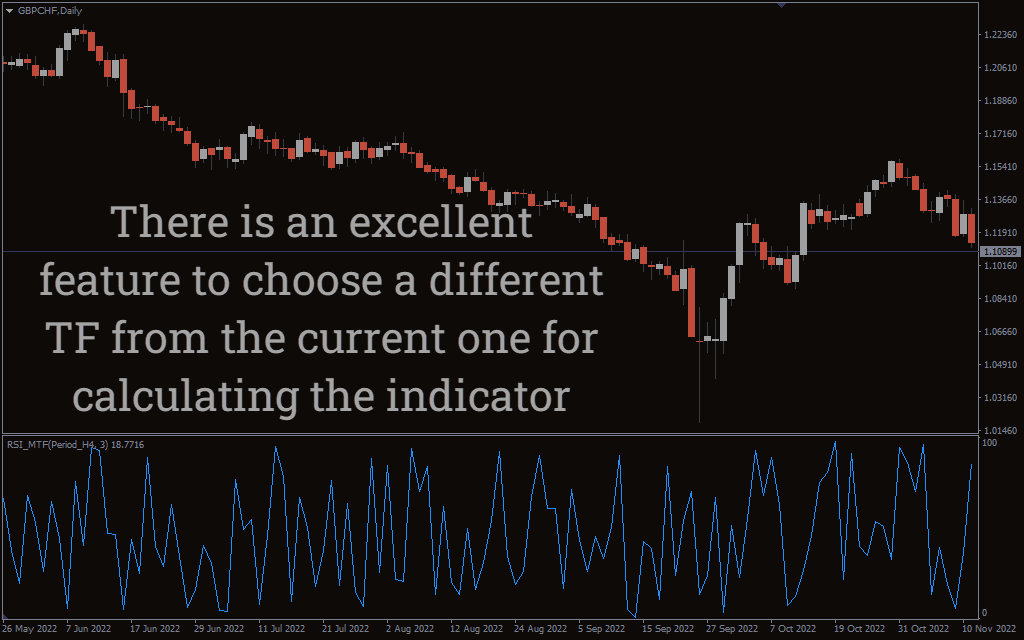
The RSI MTF indicator for MT4 is based on the Relative Strength Index indicator. It is, however, slightly more advanced as it allows you to view the RSI value of different timeframes on the same chart.
How To Use The RSI MTF Indicator For MT4
When conducting technical analysis, one can sometimes overlook the broader perspective. Often, we fixate on specific charts and timeframes, neglecting the larger context. The same oversight can occur when using the relative strength index (RSI) indicator.
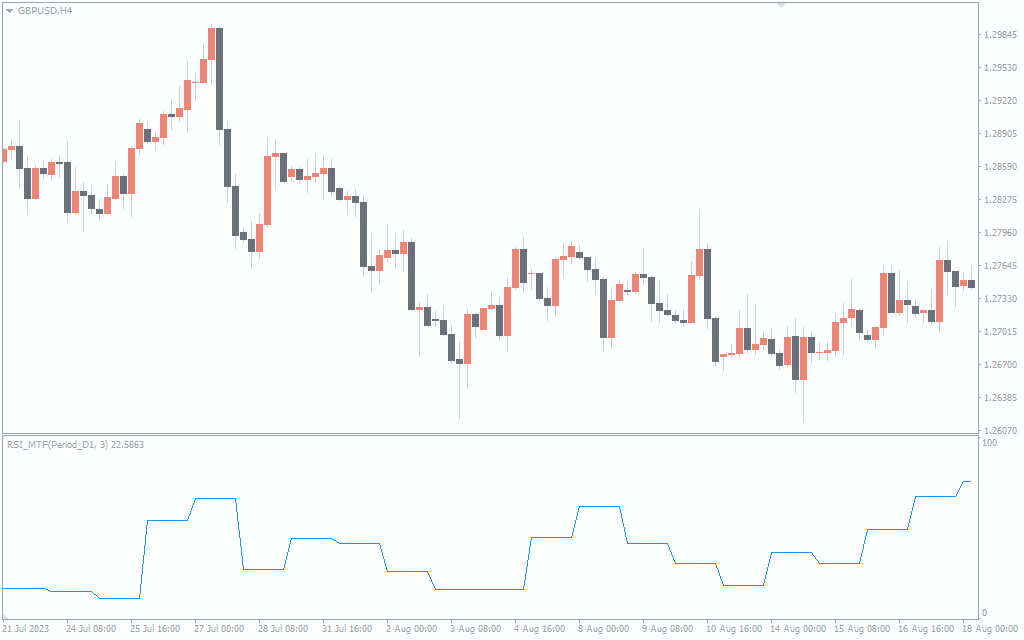
For instance, you might examine the RSI value on an M30 chart and perceive it as oversold. However, glancing at an H4 chart could reveal it’s potentially in an overbought zone. To address such scenarios, the indicator for MT4 proves invaluable.
This indicator facilitates the simultaneous assessment of the RSI oscillator across chosen timeframes. With MetaTrader 4’s RSI MTF indicator, you can quickly determine whether the relative strength index is overbought or oversold in all selected timeframes.
Conclusion
Despite its age, the RSI oscillator remains highly relevant. Functioning as a momentum indicator, it aids traders in identifying overbought and oversold conditions, enabling informed decisions.
The RSI MTF indicator for MT4 offers a comprehensive view of the oscillator’s status across all timeframes within your MT4 platform. This enhances your grasp of the overall technical landscape in the market you’re analyzing.