


Average Directional Movement Index Indicator
Determine the current trend strength with the ADX indicator for MT5. Accurate buy and sell signals.
Description
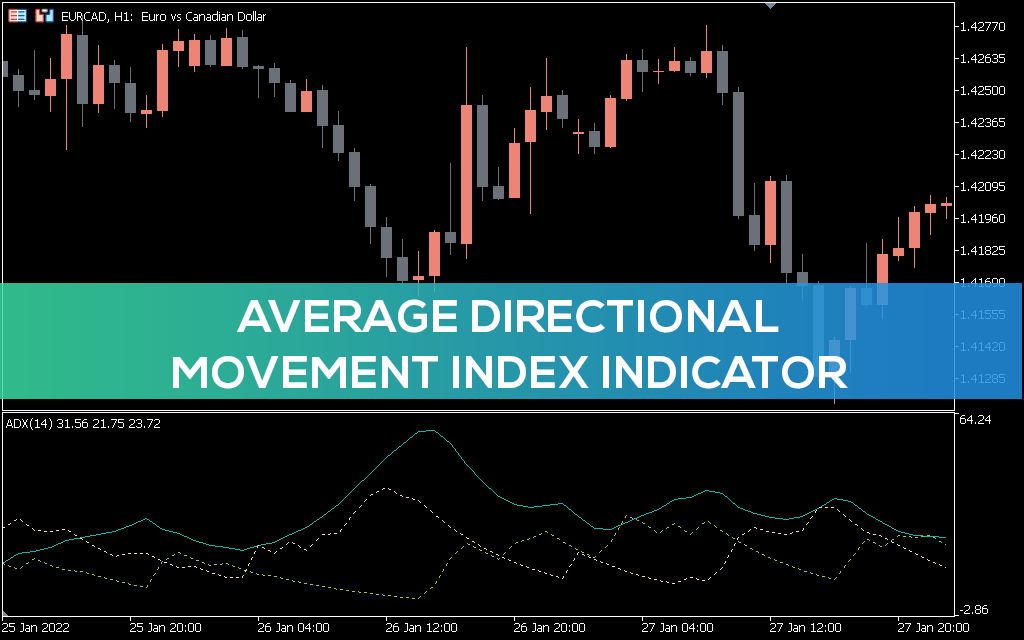
The Average Directional Movement Index also known as ADX is a technical indicator for MT5 that determines the strength of a trend.
The indicator is an average of increasing values of the price range.
In this guide, we will take a detailed look at what the ADX indicator is and how to work with it.
What is an Average Directional Movement Index Indicator?
The developer of the ADX indicator – J. Wells Wilder explained ADX in his book New Principles of Technical Trading Methods. He developed the indicator for daily commodity charts, but it can be used in other markets as well.
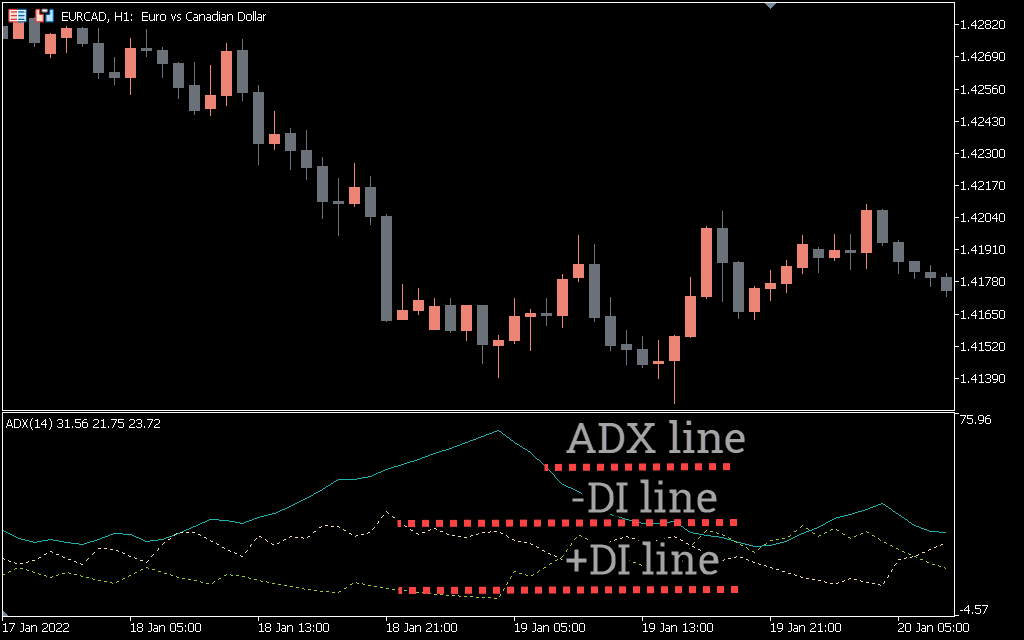
The ADX indicator uses the +DMI and -DMI lines, along with the ADX line, to measure the strength of price movement. It can be plotted using a single line with values ranging from 0 to 100. This indicator is non-directional, registering trend strength regardless of the price direction. The ADX, in general, is the ultimate trend indicator.
ADX calculations are based on the moving average of price action. An oscillator usually consists of three separate lines, which are used to determine whether you should go long or short a trade, or whether you should avoid a trade.
Essentially, the Average Directional Movement Index can be used to forecast whether a market is trending or not. This prediction aids traders in deciding whether to use a trend following system or a non-trend following strategy.
How to use the Average Directional Movement Index Indicator?
The indicator’s main purpose is to assist you in determining how strong the current trend is.
The rising of the positive directional indicator (+DI) indicates the strength of the trend. On the other hand, the strength of a downtrend is indicated by the negative directional indicator (-DI).
Wilder proposed that when the ADX value is above 25, there is a significant trend, and when it is below 20, it’s a signal that there is no trend.
When the ADX begins to fall from high levels, it’s a sign that a trend is coming to end. If the ADX falls, this may indicate that the market is becoming less directional and the current trend is weakening. As the trend changes, you may wish to avoid trading at this time.
Crosstalk between +DI and -DI is also useful. When the +DI line rises above the -DI line and the ADX exceeds 25, this is considered a buy signal. When -DI crosses above +DI and ADX rises above 25, traders often go short.
Average Directional Movement Index Indicator trading strategy
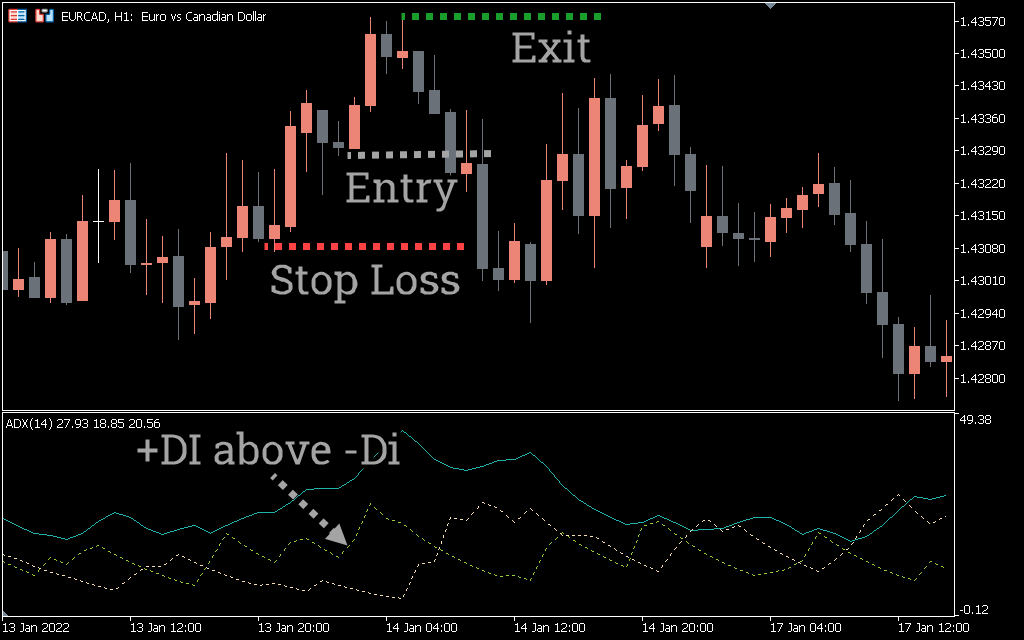
If the +DI is higher than the -DI, the market is normally in an uptrend, and you can go long. If the -DI is higher than the +DI, it indicates a downtrend.
ADX buy setup
- +DI must cross above the –DI line
- Wait for the price action to turn bullish
- Place a stop loss near the recent low
- Exit trade when the trend changes or when the +DI dips below the –DI
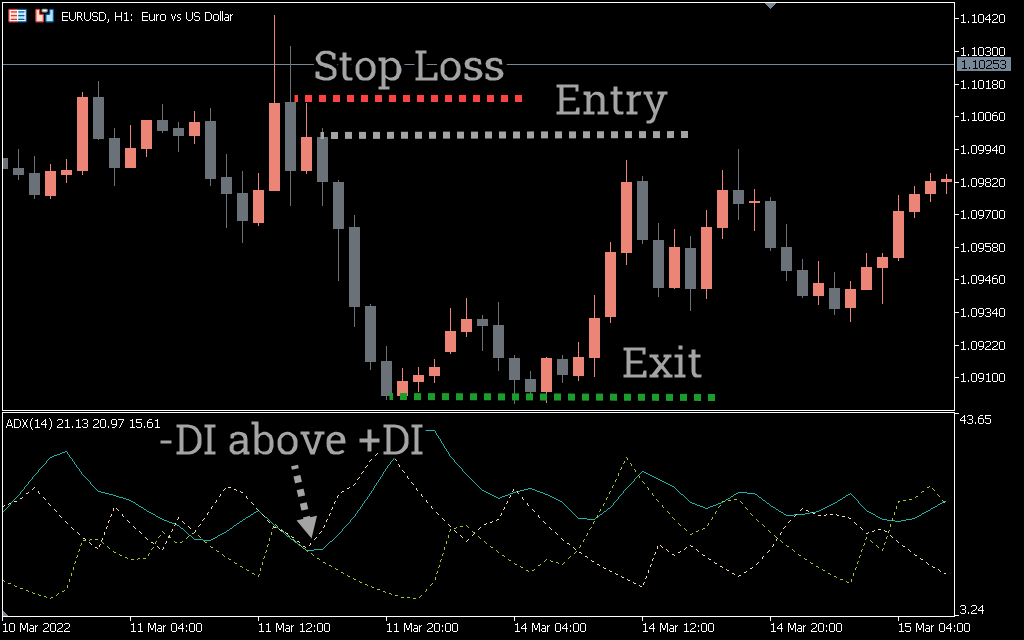
ADX sell setup
- -DI should cross above the +DI line
- Wait for the price action to turn bearish
- Set a stop loss near the recent high swing
- Exit trade when the trend changes or when the –DI dips below the +DI line
Conclusion
ADX is a useful tool for determining the overall strength of a trend. Like any other technical indicators, you should combine the ADX with other indicators to confirm the direction of the trend.