
RMI Indicator
RMI indicator for MT5 provides forex trading signals using momentum. Overbought, oversold and divergence trading signals.
Description
The RMI indicator for MT5 is an oscillator. The traditional RSI – Relative Strength Index indicator has been improved with the RMI – Relative Momentum Index. As a result, traders can use the RMI while employing RSI-compatible trading techniques. Overbought and oversold trading conditions of the RMI can be used by traders as trading signals. Additionally, the indicator shows patterns like double bottoms, double tops, and head and shoulders as well as divergence trading signals. Therefore, using this indicator, technical forex traders can buy and sell using a variety of trading strategies.
The indicator performs well on daily, weekly, and monthly price charts as well as all intraday chart time frames. Additionally, the RMI indicator is simple to use for trading for both novice and experienced forex traders.
However, because it makes use of a particular period’s momentum, the RMI is more responsive than the RSI. However, relative strength index (RSI) values are determined by comparing the price changes of two adjacent bars.
RMI Indicator For MT5 Trading Signals
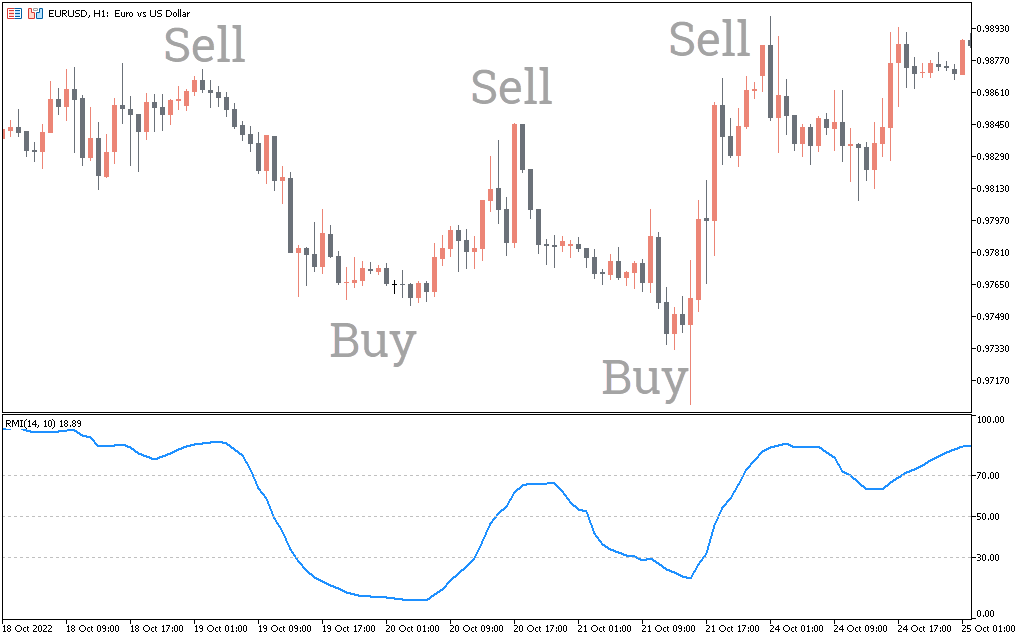
The above EURUSD H4 candlestick chart shows the RMI indicator for MT5 in action. The indicator line and overbought and oversold levels are colored red. Moreover, the overbought and oversold levels are at 70 and 30 respectively.
If the indicator rises above 70 levels, this indicates that prices are already in the overbought zone. Thus, forex traders should wait for the indicator value to cross below the 70 level. As soon as the values change, traders can expect prices to fall. Thus, traders can place a SELL trade with a stop loss above the previous swing high. The best profit-taking strategy is to hold the position until the opposite trading signal.
Similarly, if the indicator values fall below the 30 level, this indicates that the price is in an oversold condition. Forex traders should wait for the indicator to reverse and rise above the 30 level. Once the 30 levels are broken, traders can place a buy trade with a stop loss below the previous swing low. The best profit target in this strategy is to hold the position and take profits on the opposite trading signal.
The second trading strategy is to identify chart patterns such as double bottoms, double tops, and head and shoulders. These patterns tend to alert the trader to an impending price move. Thus, forex traders can act in advance.
The third trading strategy is to identify divergence and buy and sell accordingly. If the price and the indicator move in opposite directions, a divergence is formed. Divergence is a leading indicator and signals possible price reversals. Forex traders can spot divergence and trade profitably using the RMI indicator.
Conclusion
The RMI indicator for MT5 is the best alternative tool for forex traders using RSI. Traders accustomed to Forex trading using RSI will find a big difference when using the RMI indicator. RMI is much more sensitive than RSI and provides all trading strategies like RSI. In addition, forex traders can download the indicator for free and install it easily.