RSI Inverse Fisher Transform Indicator
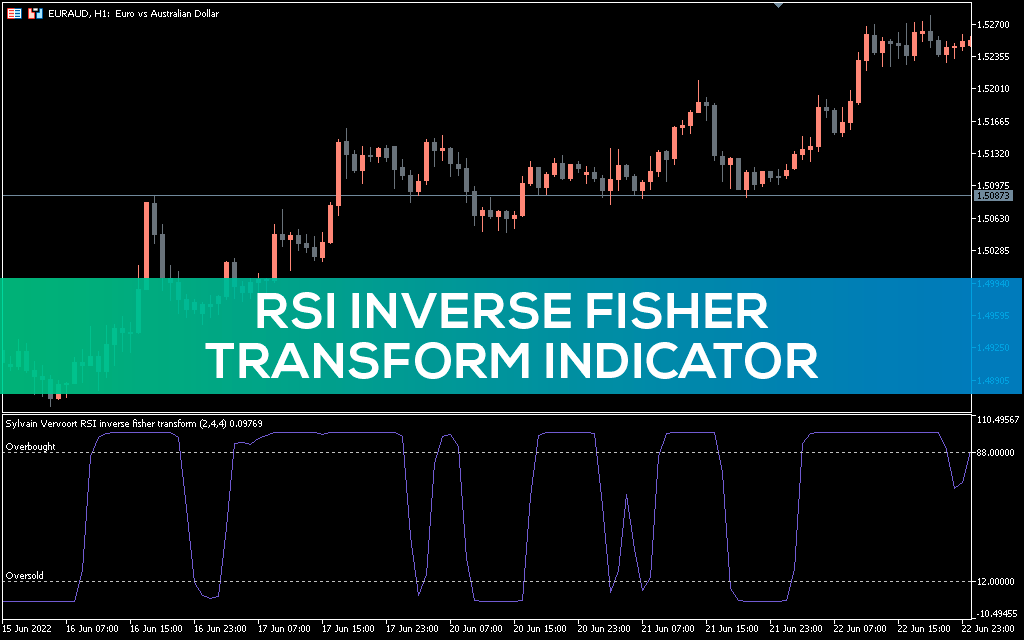
RSI Inverse Fisher Transform Indicator for MT5 with better oversold and overbought BUY and SELL signals using RSI.
Description
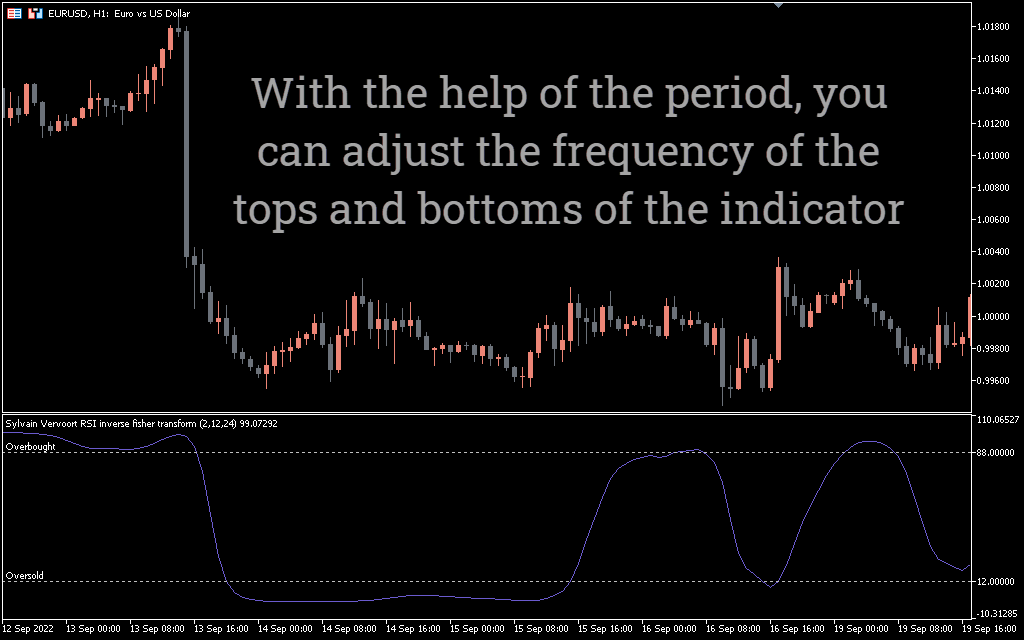
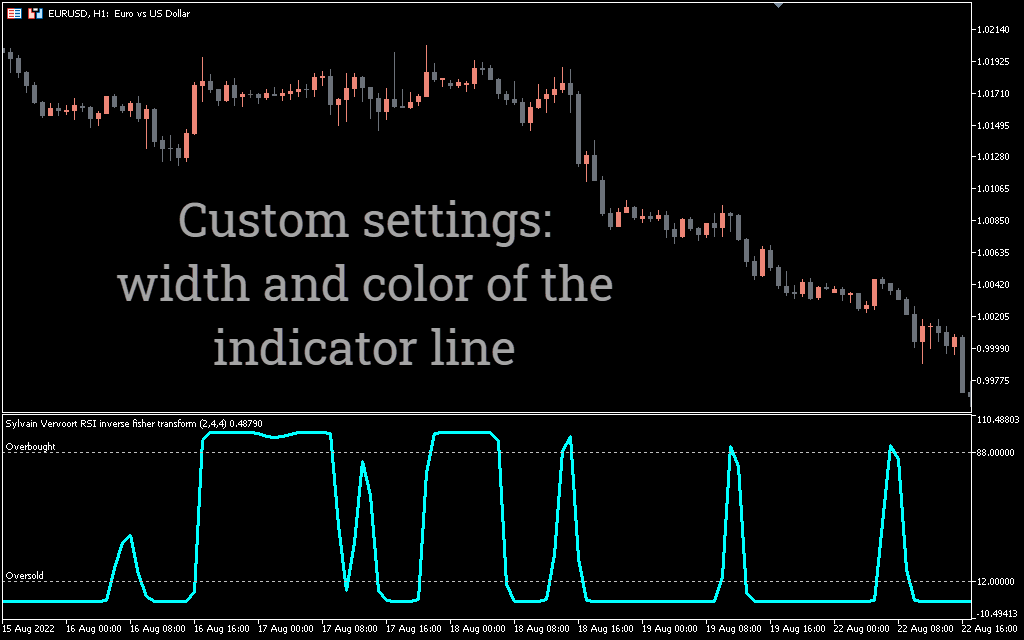
The RSI Inverse Fisher Transform indicator for MT5 smoothes the price using a moving average. It also calculates RSI values for smoothed prices and applies a Fisher filter to the results. As a result, the indicator determines the best entry points. Thus, with the help of the indicator, forex traders can successfully BUY and SELL.
The indicator works well on all intraday price charts as well as daily, weekly and monthly price charts. In addition, forex traders can apply price values of other timeframes and display the indicator window on the current price chart. As a result, forex technical traders can use the indicator to trade multiple time frame (MTF) technical trading strategies.
The indicator is best suited for beginners and experienced forex traders. New forex traders can use overbought and oversold trading signals to trade successfully. However, advanced forex traders combine multiple indicators and merge trades.
RSI Inverse Fisher Transform Indicator For MT5 Trading Signals
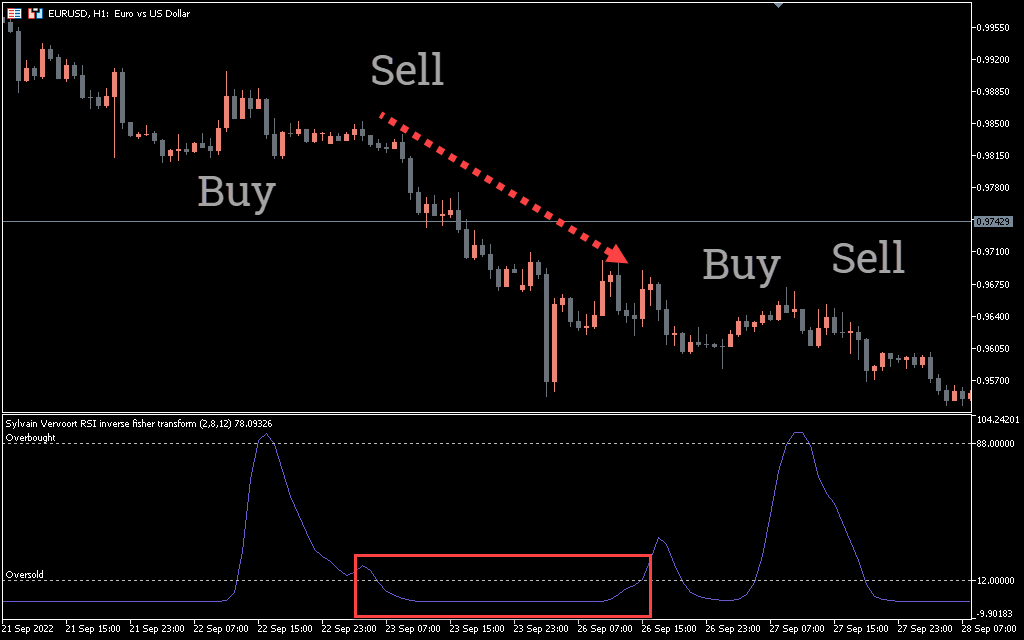
The above EURUSD H4 candlestick chart shows the reverse Fisher Transform of the RSI indicator for MT5 in action. The oscillator displays oversold, mid and overbought levels as dotted lines in the indicator window. The indicator displays overbought oscillator values in red and oversold values in blue. However, values in between are displayed in dull gray.
If the color of the oscillator line is red, the price has reached the oversold zone. But the best entry point is to wait for the oscillator to change its color from red to dull gray. Once the oscillator changes to a dull gray forex, traders can enter the market with a BUY trade with a stop loss below the previous swing low. The indicator does not indicate a profit target, so traders should apply additional strategies to determine the best profit target. As a general rule, a risk/reward ratio above 1:2 or an opposite trading signal is a good profitable exit point.
Similarly, if the color of the oscillator line is blue, the price has reached an overbought condition. Thus, forex traders can expect a bearish price reversal. However, it is best to wait until the color changes to dull gray and place a SELL trade. The best stop loss is above the previous swing high, while traders can take profits with a good risk-reward ratio or the opposite trade signal.
Conclusion
The RSI Inverse Fisher Transform Indicator for MT5 helps forex traders use overbought and oversold levels to determine BUY and SELL entry points. In addition, the indicator provides the best entry points by combining moving averages, RSI and Fisher filters. In addition, forex traders can download the indicator for free and install it easily.