

Volatility Quality Zero Line Indicator
The Volatility Quality Zero Line indicator is one of the best volatility indicators in the Forex market. It also serves as a trend trading indicator. Learn how to include the volatility indicator in your technical analysis here.
Description
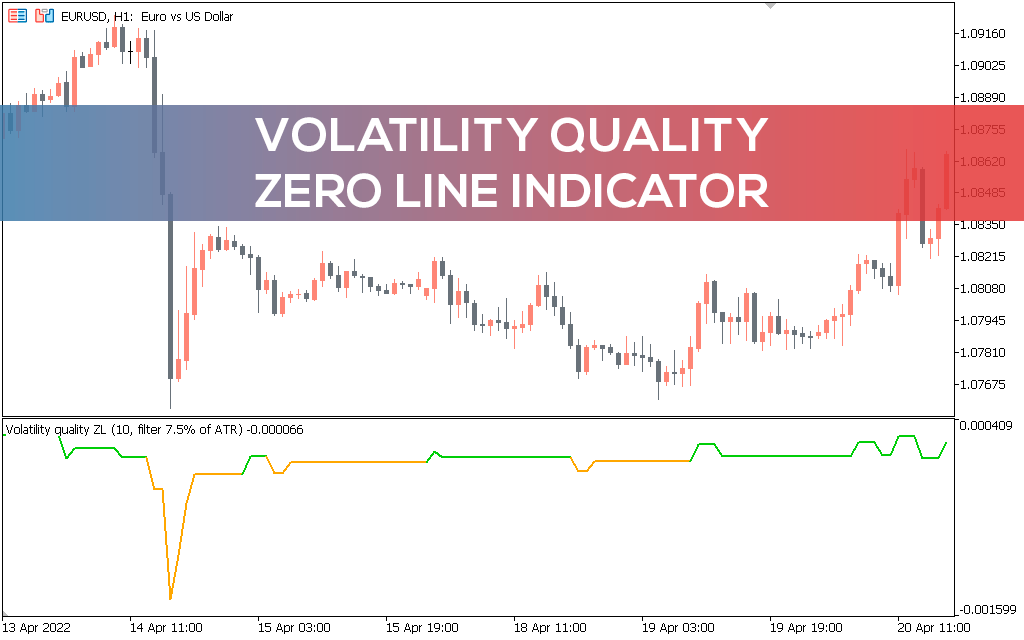
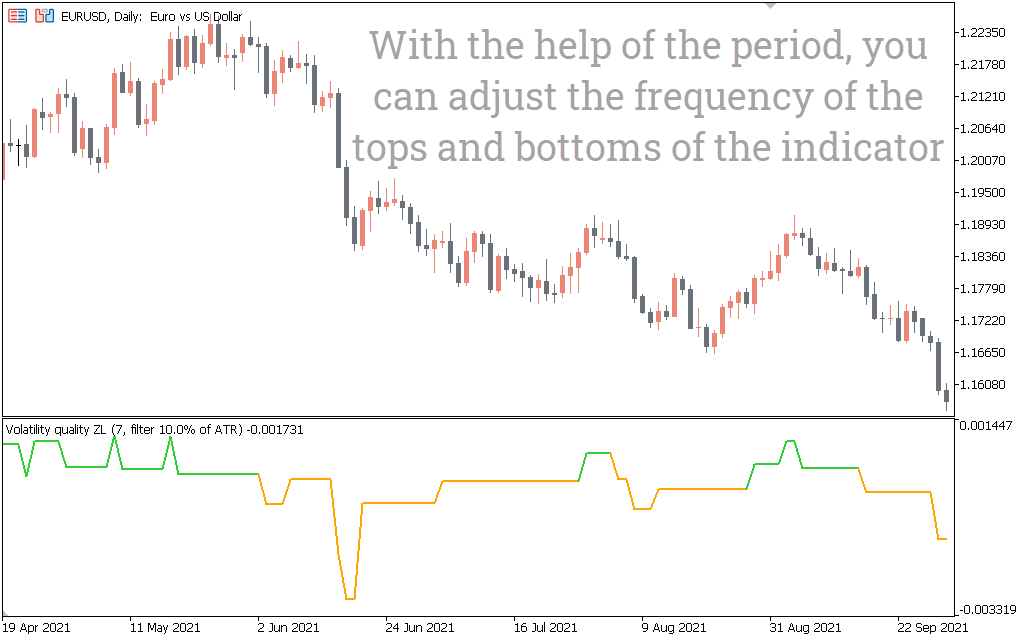
The volatility quality zero line is both an indicator of trend trading and volatility. It offers a price trend in two colors, orange and green. The green line indicates that the market is in an uptrend, while the orange line indicates a downtrend. As for volatility, the farther the line is from the zero line, the greater the volatility in the market.
The indicator is a variant of the Volatility quality indicator invented by Thomas Stridsman. But the volatility quality zero line indicator differs from the original indicator in that it is less sensitive. It does not give as many signals as the original indicator and, as a result, is more resistant to false breakouts. It uses the Open High Low Close values of the weighted moving average to get its values. On the other hand, the market volatility indicator may react slowly to price movements.
How to Trade Using the VQ ZeroLine Indicator
The way to trade forex using an indicator is to follow the signals. Go long when the line changes from orange to green and go short when the line changes from green to orange.
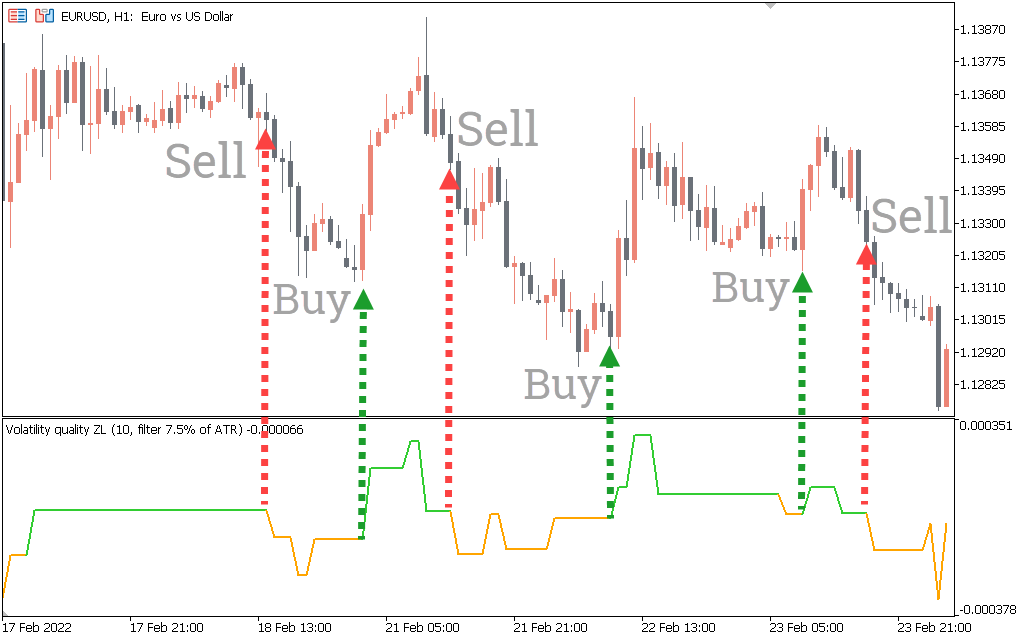
These signals coincide with when the line crosses the zero line.
Trade Management with the Indicator
Trade entries with the volatility quality zero line indicator are only one part of the equation. The other part is to know how to set stop loss and take profit using an indicator.
Take profit
To set take profit levels using the indicator, close trades at the start of new signals. For example, when the volatility trading indicator changes color from green to orange, close all long positions. And when the indicator changes from orange to green, close all short positions.
Stop loss
One way to set a stop loss level is to mark the most recent high or low before the volatility quality zero line indicator gives a signal. For example, look at the most recent high after the indicator changed from bullish to bearish and place a stop loss above it. This method is based on the idea that for a downtrend to occur in the financial market, there must be lower lows and lower highs. And for an uptrend, there must be higher highs and higher lows.
You can also use this stop loss method to filter your trades. If you find that the last high or low is too far away from where the new signal is, this may be a sign that this trade is better not to open. The reason for this is that the market can run out of momentum before you get enough pips out of the trade.
Who is the Volatility Indicator Best for?
The Volatility Quality Zero Line Indicator is the best for any forex trader. It is easy to use and requires no technical knowledge before applying it to your trading.