


RSX Indicator
RSX is a suitable indicator for trading with the trend. Perfect trend reversal detector.
Description
The RSX indicator detects market dynamics and price peculiarities by transforming accumulated market history data. This improved version of the RSI eliminates market noise to prevent fake market signals hence more accurate signals. The best part is that the indicator can be smoothed without lagging.
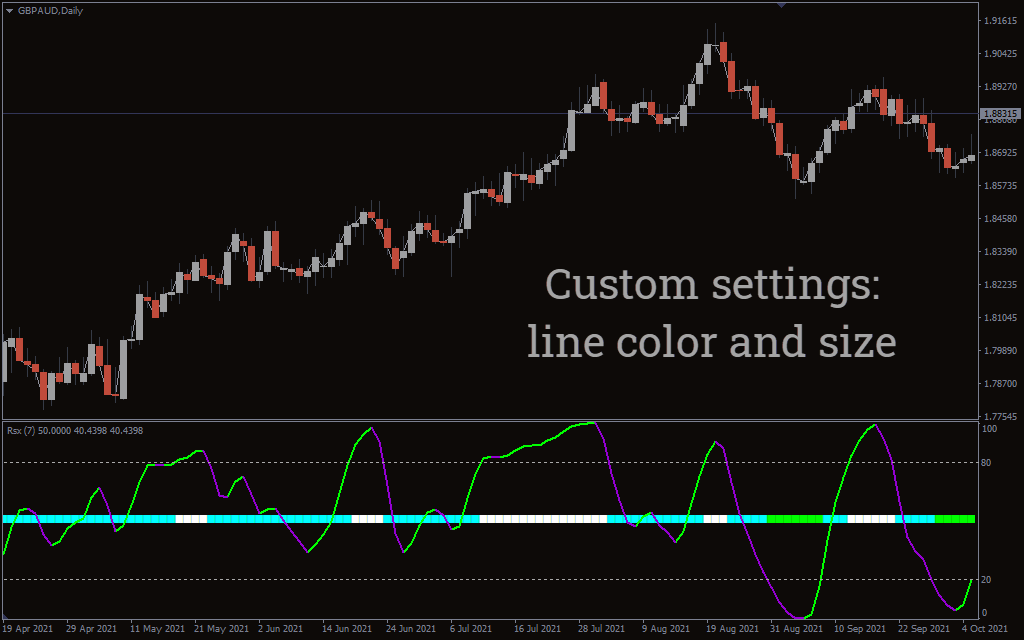
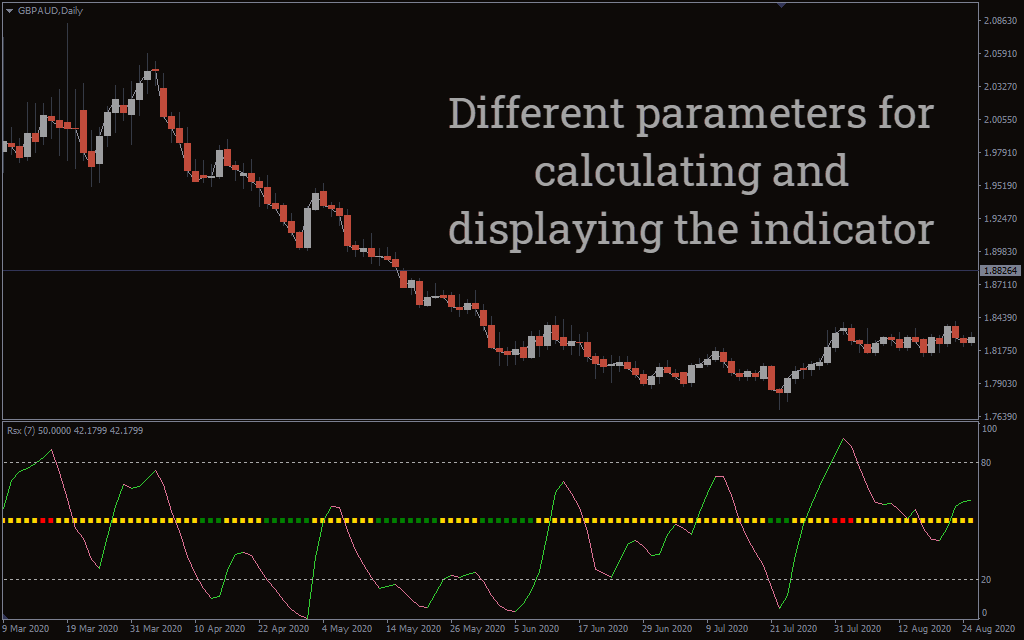
The indicator window forms below the market chart and features overbought and oversold areas. It also consists of a moving average line that depicts the market movement which changes color from lime green to pale violet. RSX also features a broad line column on the zero level that changes color to red, green, and yellow. The yellow color signifies market decision. You can use the indicator for day trading, scalping, and swing trading.
How Do You Use An RSX Indicator?
The indicator values start from 0 to one hundred. When the indicator line falls below 20 level, it is an oversold area, while above 80 represents an overbought area.
Buy Signal
The buy signal occurs when the indicator MA line turns green and moves upwards. The central line changes color to green. Also, if the price is in an oversold area, it is a tell-tale sign that it is ripe for trend reversal, and you get ready to open a long position.
Sell signal
The MA line moves in a downtrend and changes color to pale violet red. The indicator also changes to red color. If the price is in an oversold area, it is a tell-tale sign of an impending trend reversal.
Exit Strategy
Exit if the indicator changes to red when the uptrend is running or when the indicator changes to green during a bearish market.
Can You Install Custom Indicators In Mt4?
RSX is not among the default indicators on MT4. But you can download it for free on our site. After download, copy the indicator file into the MQL4 indicator folder of the MT4 trading platform.
Trading Example
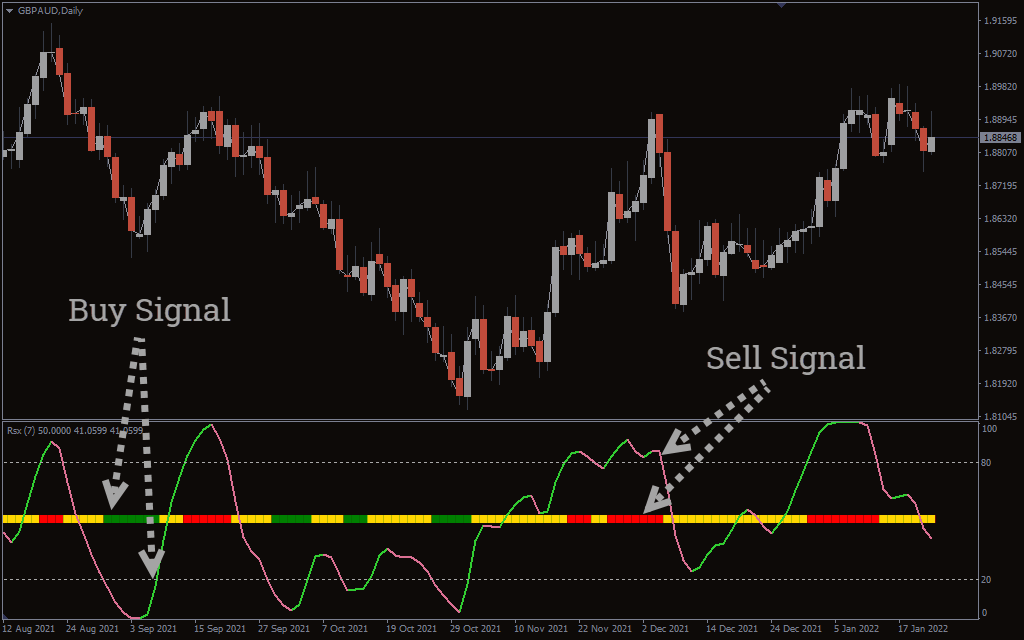
The indicator’s weight is shown above in the Great Britain pound against the Australian dollar. The center indicator line posts a green color indicating a buy signal. The moving average also changes color to lime green and matches the uptrend direction of the market.
Similarly, the indicator posts a red color on the indicator line, signaling an ideal time to enter a short position. Notice how the moving average changes color to a pale violet and mimics the market in a downtrend. This is an ideal sell signal.
Conclusion
The RSX indicator provides traders with ideal trade entry points. This means that you can identify ideal places to enter and exit trades. The trade comes with a moving average that depicts price movements and changes to lime green for uptrend and violet during a downtrend. The indicator line at the center gives signal confirmation making the indicator an ideal tool for accurate signal. It is ideal to trade with the trend and reap maximum profits.