
TTM Trend Indicator
TTM Trend indicator for MT4 provides BUY and SELL forex trading signals candle color changes on Bullish and Bearish trend.
Description
The TTM Trend indicator for MT4 is the best trend following indicator for forex trend traders. It’s pretty straightforward to define the Bullish and Bearish price trends. The indicator changes the candle color to BLUE for the Bullish market and RED for bearish market conditions. So, forex traders can BUY or SELL using the color change of candles. The indicator is best suited for trend traders working with trend-following technical trading strategies.
The indicator suits well for new and advanced forex traders. New forex traders can identify the trend changes and enter the trend early using the color changes. However, advanced forex traders can use the indicator in confluence with other trend indicators. The indicator works well in all intraday price charts as well as the daily, weekly, and monthly price charts.
TTM Trend Indicator For MT4 Trading Signals
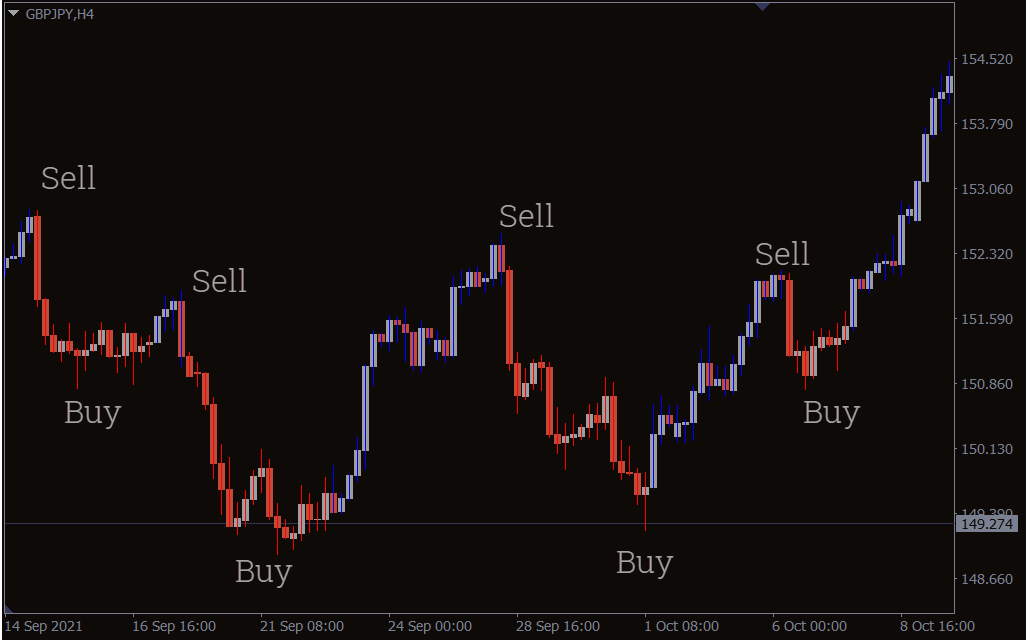
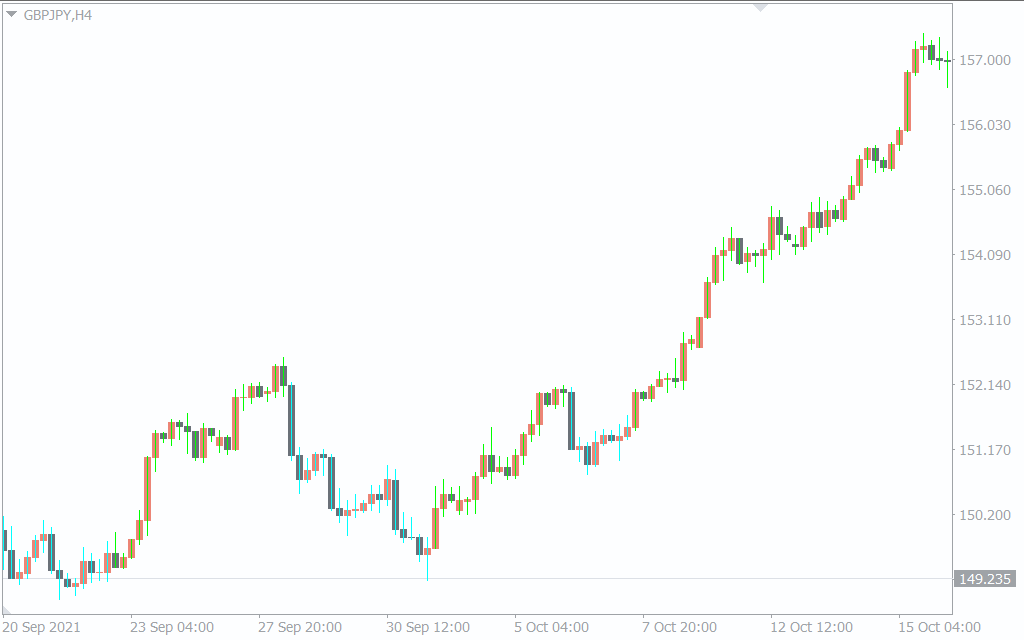
The above GBPJPY H4 price chart shows the TTM trend indicator for MT4 in action. The indicator shows the Bullish candles in BLUE and Bearish candles in RED. Based on the color of candles forex traders can enter a BUY or SELL position.
If the candle color changes from RED to BLUE it indicates the beginning of a Bullish price trend. So, forex traders can enter the market with a BUY position. The best take profit point is the opposite trading signal as this enables the traders to ride the trend completely. However, technical traders can exit the position with profits with a good risk and reward ratio. The best stop loss for this position is the previous swing low, however, the opposite trading signal is also a good exit.
Similarly, if the candle color changes from BLUE to RED it indicates the commencement of a SELL signal. So, forex traders can open a SELL trade and follow a bearish trading strategy. The best point to book the profits is the opposite trading signal as it helps the trader to benefit from the trend. On the other hand, forex traders may exit if the trade achieves a good risk-reward ratio. Concerning the stop loss, it would be better to exit at the opposite trading signal. Alternately, technical traders can exit above the previous swing high.
The indicator works well for the top-down approach of technical analysis. The trend in long-term charts tends to last longer and is generally stable. So, forex traders can use the higher time frame price charts to identify the general trend. While the lower time frame charts can be used to identify the best entry point.
Conclusion
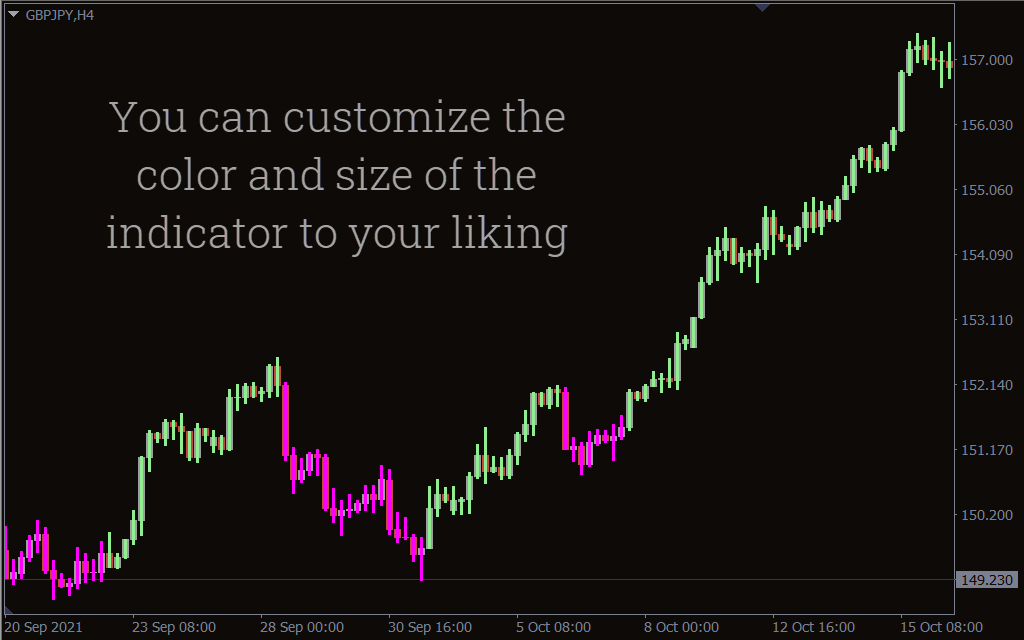
The TTM trend indicator for MT4 helps the forex traders to identify the trend primarily. The understanding of the trend direction enables the forex technical trader to add additional technical analysis. The possibility of riding the trend and benefitting from the entire trend helps the trade to be more profitable. However, for best results traders can use price action and other indicators. Additionally, the indicator is free to download and easy to install.