
Money Flow Index (MFI) Indicator
Money Flow Index (MFI) indicator for MT5 shows forex trading signals based on oversold, overbought and convergence, divergence.
Description
The Money Flow Index (MFI) Indicator for MT5 shows the flow of money into and out of a trading instrument. However, the indicator uses trading volumes as a key parameter. The indicator is an oscillator and resembles the classic RSI – Relative Strength Index. Since the indicator is an oscillator, it gives overbought and oversold trading signals. In addition, the indicator generates trading signals based on divergence and convergence. Thus, Forex traders can benefit from trading both technical strategies.
The indicator is well suited for beginners and experienced Forex traders. New traders can benefit from overbought and oversold trading signals. On the other hand, advanced technical traders can benefit from convergence and divergence trading and apply sophisticated Forex trading strategies. The indicator works well on all intraday timeframes as well as daily, weekly and monthly charts.
Money Flow Index Indicator For MT5 Trading Setup
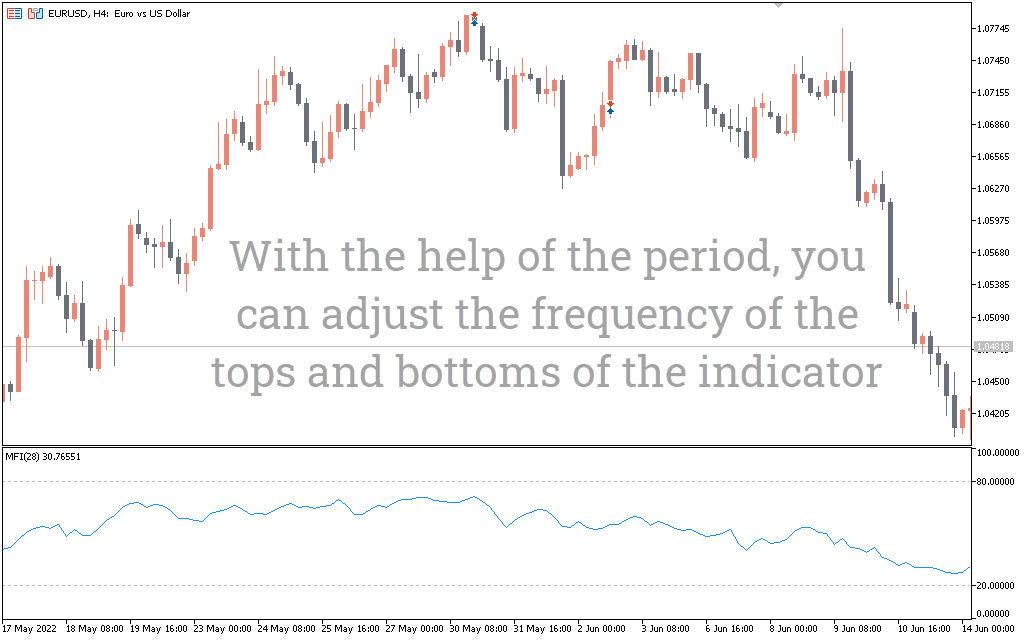
The chart above shows the Money Flow Index For MT5 indicator in action. The indicator is an oscillator and displays the values in the BLUE line. In addition, the indicator plots the upper level 80 and the lower level 20 and displays it in a separate indicator window.
The indicator is an oscillator and Forex traders consider levels 80 to be oversold and levels 20 to be overbought. Thus, technical traders can apply overbought and oversold trading strategies similar to other oscillators.
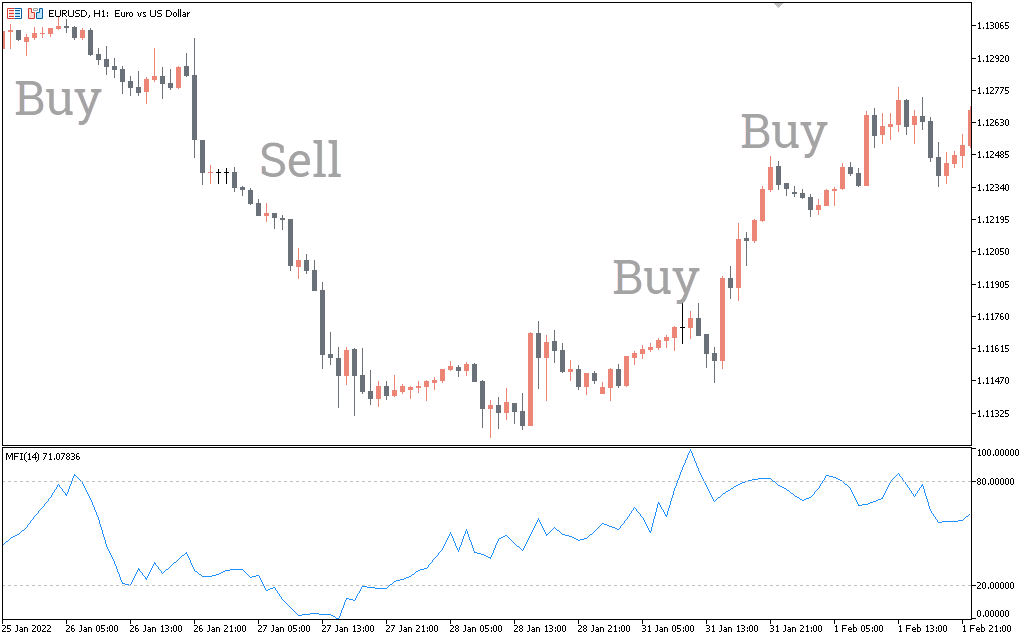
If the indicator reaches the 80 overbought level, traders should expect the price to reverse and turn bearish. Thus, traders can place a SELL trade with a stop loss above the previous swing high. The best take profit is to wait until prices reach oversold conditions.
Similarly, if the indicator reaches the 20 oversold level, traders should expect the price to be bullish. Thus, traders can enter the market with a BUY position with a stop loss below the previous swing low and exit on the opposite signal.
Divergence And Convergence Trading Signals
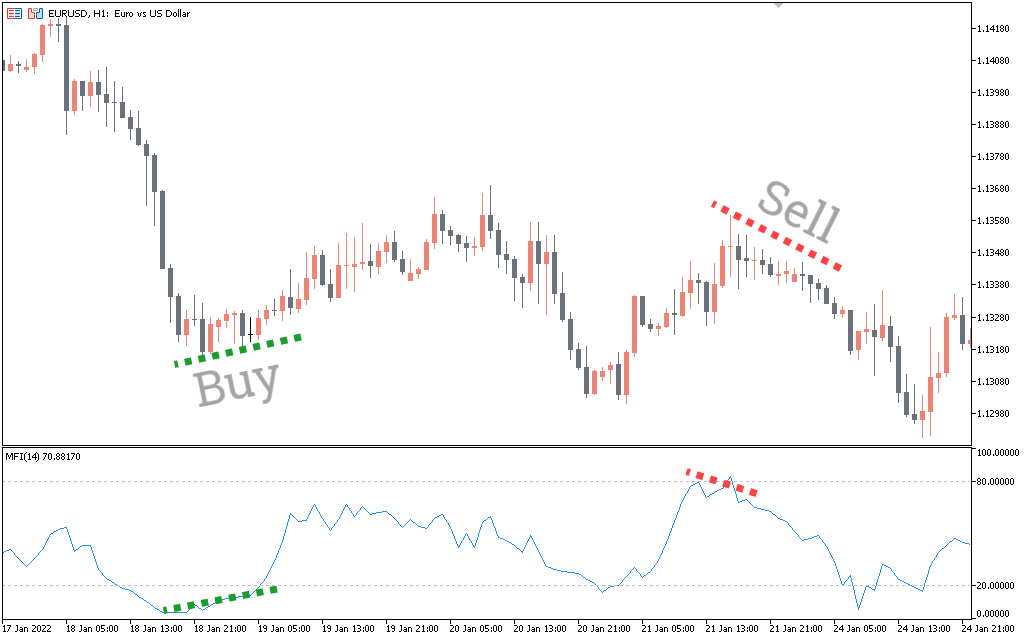
The EURUSD H1 chart above shows divergence and convergence trading signals. The MFI indicator gives the best trading signals, since the mismatch between price and indicator values occurs frequently and coincides with peaks. Thus, Forex technical traders can apply divergence and convergence trading strategies.
If the price continues to make higher highs while the indicator makes lower highs, this indicates a possible price reversal from bullish to bearish. Thus, Forex traders can enter a SELL position with a stop loss above the previous swing high.
Similarly, if the price makes lower lows and the indicator makes higher lows, this indicates a price reversal from bearish to bullish. Thus, traders can place a BUY position and enter the market with a stop loss below the previous swing low.
Conclusion
The MFI Indicator For MT5 provides technical trading signals in several ways. However, for best results, oversold and overbought conditions, as well as divergences and convergences, must be confirmed using price action and additional technical indicators. The indicator gives reversal signals that are prone to false signals. As such, they need to be confirmed by other technical instruments as well as support, resistance, channels and trendlines. In addition, Forex traders can download the indicator for free and install it easily.