

Standard Deviation Channel Indicator
Standard Deviation Channel Indicator for MT4 draws channel automatically. Shows support resistance, Bullish, bearish trends, SL and TP. Free to Download.
Description
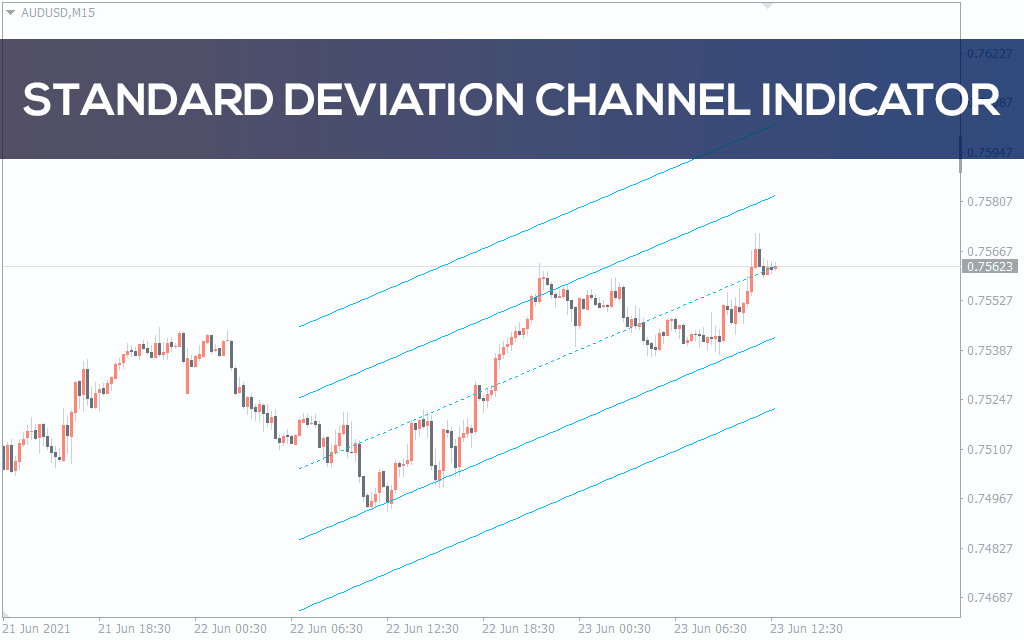
The Standard Deviation Channel Indicator for MT4 can plot channels automatically on the price chart based on the price’s standard deviation. The indicator provides inner and outer channel line which acts support and resistance. Additionally, the indicator shows the BULLISH and BEARISH market conditions.
For those who enjoy working with channel-based tools, we also feature the Auto Channel Indicator and the Linear Regression Channel Indicator, both of which complement the Standard Deviation Channel with slightly different approaches to channel analysis.
When I first installed the Standard Deviation Channel Indicator, I found the process smooth — just drop the file into the MT4 indicators folder, refresh the platform, and it was ready to use. Once applied to the chart, the clean sky-blue lines stood out immediately. What impressed me most was how objective the channel placements felt compared to drawing them manually. In my live testing, it helped reduce emotional bias because the levels were generated mathematically, not by guesswork. I especially liked how reliable the midline was for spotting early signs of a trend continuation or reversal.
The indicator is best suited for new forex traders and advanced traders. It provides SUPPORT, RESISTANCE, ENTRY, and EXIT levels with STOP LOSS and TAKE PROFITS. While showing the BULLISH BEARISH market trends. The indicator works well in all intraday time frames and long-term trading. Additionally, the indicator is free to download and easy to install.
Standard Deviation Channel Indicator Trading Signals
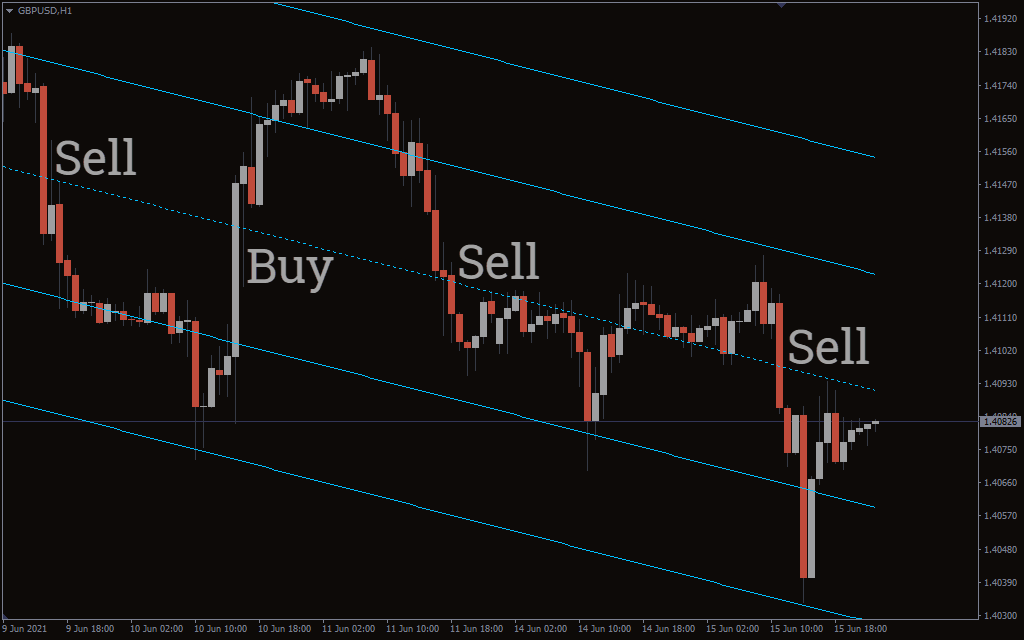
The above GBPUSD H1 chart shows the Standard Deviation Channel Indicator for MT4 in action. The indicator displays the MID channel line as DEEP SKY BLUE color dotted line. While the INNER and OUTER channel lines are displayed as DEEP SKY BLUE color normal lines.
Since channel lines act as SUPPORT and RESISTANCE levels, the inner and outer channel levels are the best-suited BUY and SELL entry positions. Forex traders consider the price to be BULLISH if the price goes above the mid-channel line of the Standard Deviation Channel Indicator for MT4.
Oppositely, the price enters a BEARISH trend once the price falls below the mid-channel line. As a result, forex traders can BUY if the price rises from a lower channel line and crosses the midline. Traders can have a trading strategy to target the upper channel to take profits. While having a stop loss at the lower channel for the positions.
On the other hand, forex traders can have SELL positions once the price closes below the mid-channel line of the Standard Deviation Channel Indicator for Metatrader. At the same time, targeting the lower channel as take profit and a stop loss at the upper channel.
Aggressive forex traders can place BUY trades once the price hits the outer lower channel. And hold the positions targeting to take profit at the opposite upper channel. Oppositely, technical traders can initiate SELL trades from the outer upper channel. However, forex traders must keep in mind the price action, trading volume, and intraday support, and resistance levels for best trading results.
Pros and Cons of the Standard Deviation Channel Indicator
 Pros
Pros
- Automatically generates precise channels, saving time and reducing bias.
- Works on any timeframe from intraday to monthly.
- Simple visual representation with clear support and resistance levels.
- Beginner-friendly but also valuable for experienced traders.
 Cons
Cons
- May generate false signals during highly volatile or news-driven markets.
- Best results require combining with other tools like volume or price action.
- Channels may feel “too rigid” for traders who prefer more flexible charting.
Conclusion
The Standard Deviation Indicator for MT4 is the best tool to create a channel automatically, eliminating the forex trader’s discretion. As a result, the forex trader obtains the support and resistance levels mathematically which acts as the best entry and exit points. The indicator works on all intraday charts and in daily, weekly, and monthly charts as well. It can be downloaded for free and installed easily by forex traders.
For traders interested in optimizing channel strategies further, I also recommend checking our blog post on Most Trendy Currency Pairs to see how pairing this indicator with the right instruments can amplify results.
Frequently Asked Questions (FAQ)
 Does the Standard Deviation Channel Indicator repaint?
No, once the channel is drawn, it remains fixed. Only new bars will extend the channel further.
 Which timeframe works best?
It can be applied to all, but H1, H4, and D1 generally provide cleaner signals.
 Can I use this indicator for scalping?
Yes, though channels on lower timeframes may be less reliable due to noise. Combining with volume helps.
 Is this indicator suitable for beginners?
Absolutely. Its automatic plotting makes it easier for new traders to understand support and resistance levels.
 Should I use it as a standalone tool?