

DMI Indicator
It is a technical indicator that can be used to grasp the change in trend. It can be used to enter and exit the market at appropriate levels.
The DMI (Directional Movement Index) indicator analyzes the area of the last bar that stands in relation to the candlestick that appeared earlier. So, in a situation if the low and high of the last one are higher than the values of the previous one, then the area of the last bar that protrudes upward relative to the previous candlestick is defined as a bullish direction. And in a situation where the low and high price is lower than the value of the previous bar, then the part of the extreme candlestick protruding downward in relation to the penultimate candlestick is defined as a bearish direction.
How does DMI indicator work?
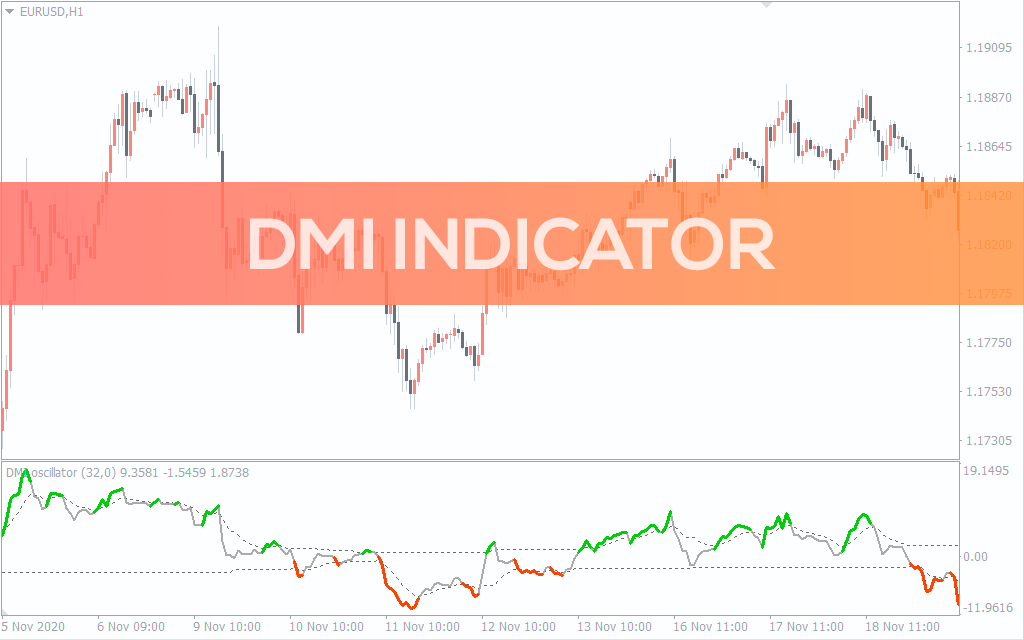
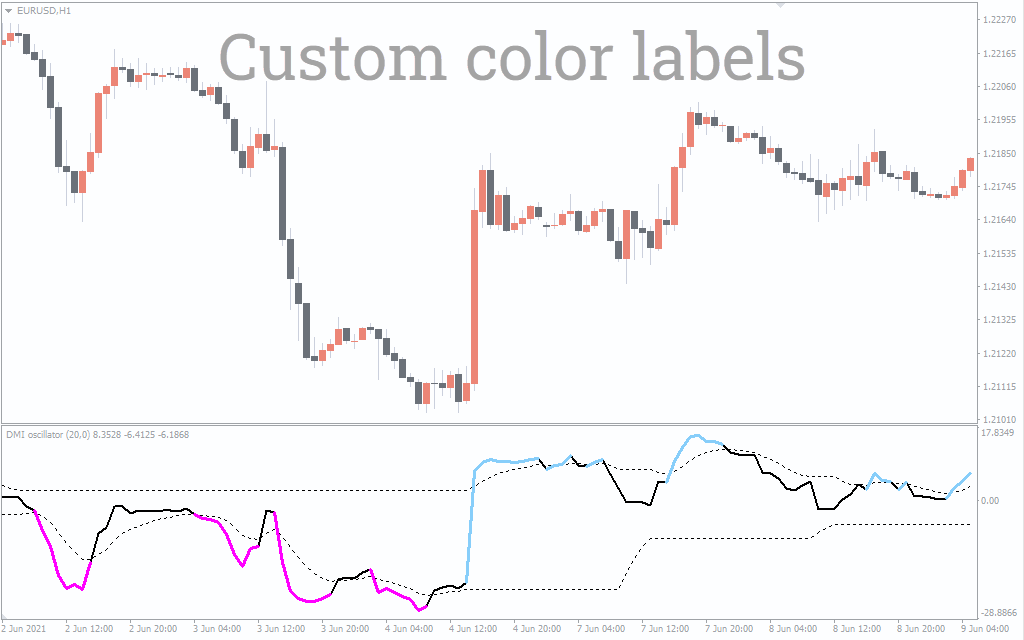
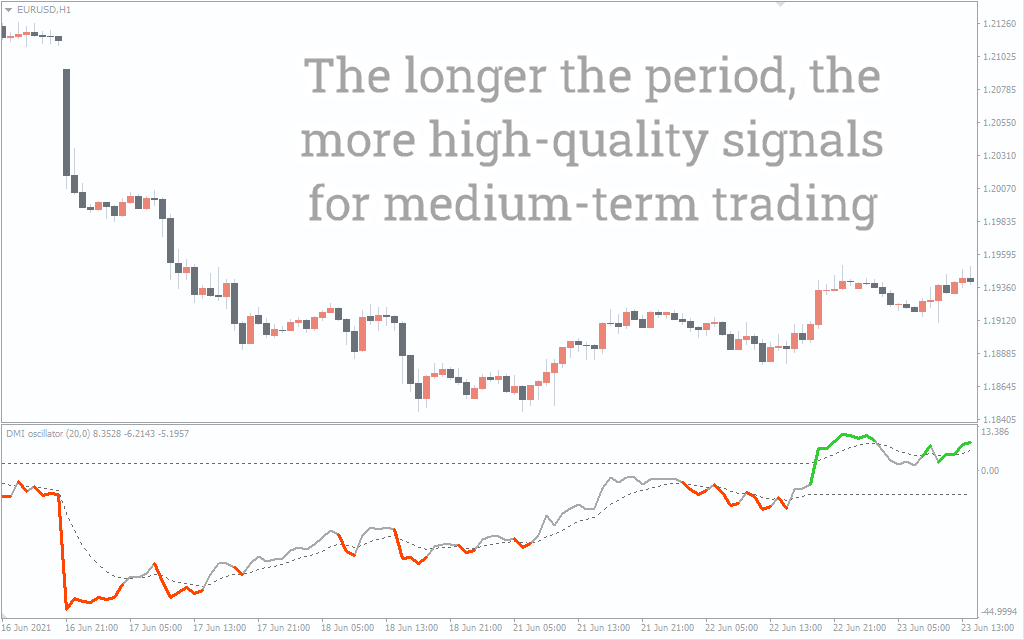
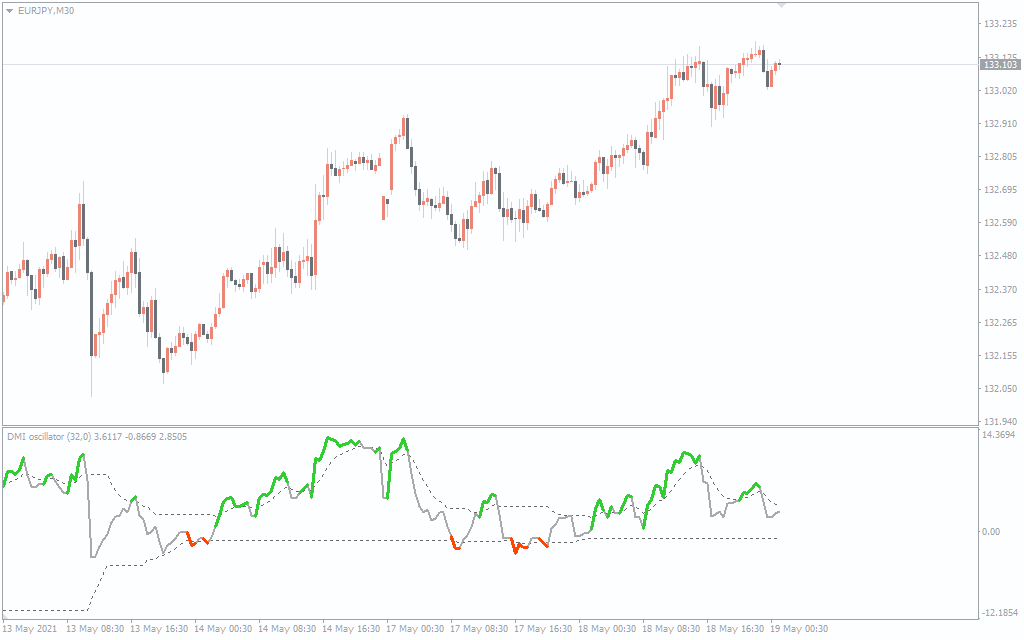
DMI is an oscillator indicator which is very easy to understand for the beginner traders as well because of its visual representation. The indicator appears with three colors, each represents a certain phase of the market. The grey color represents consolidation while green color appears when the market starts entering into a bullish phase. The orange color appears when the market enters the bearish phase.
However, you may see noise in the indicator as well and it is subjective for every instrument that you analyze using the indicator. Hence, it is better to play with signal period and DMI period and also try switching to different timeframes to reduce the noise.
DMI indicator trading strategy
Following is a simple strategy based on DMI indicator:
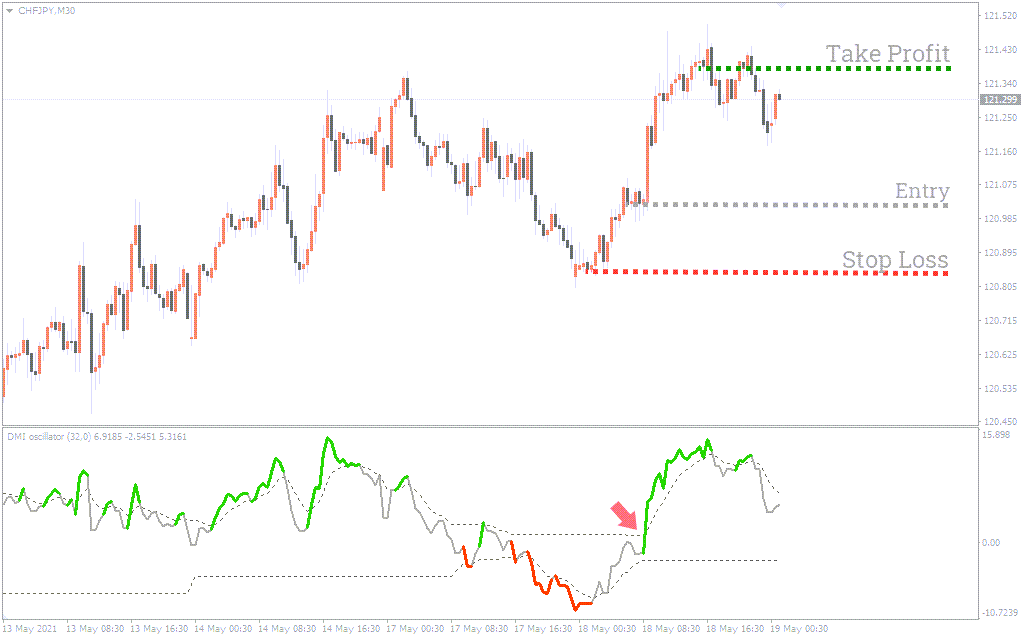
DMI indicator buy strategy
- Wait for the indicator color to get green.
- Confirm the indicator value to be above zero.
- Wait for a bullish candle to close.
- Enter the long trade with stop-loss around recent swing low. Place the profit target at next resistance level.
DMI indicator sell strategy
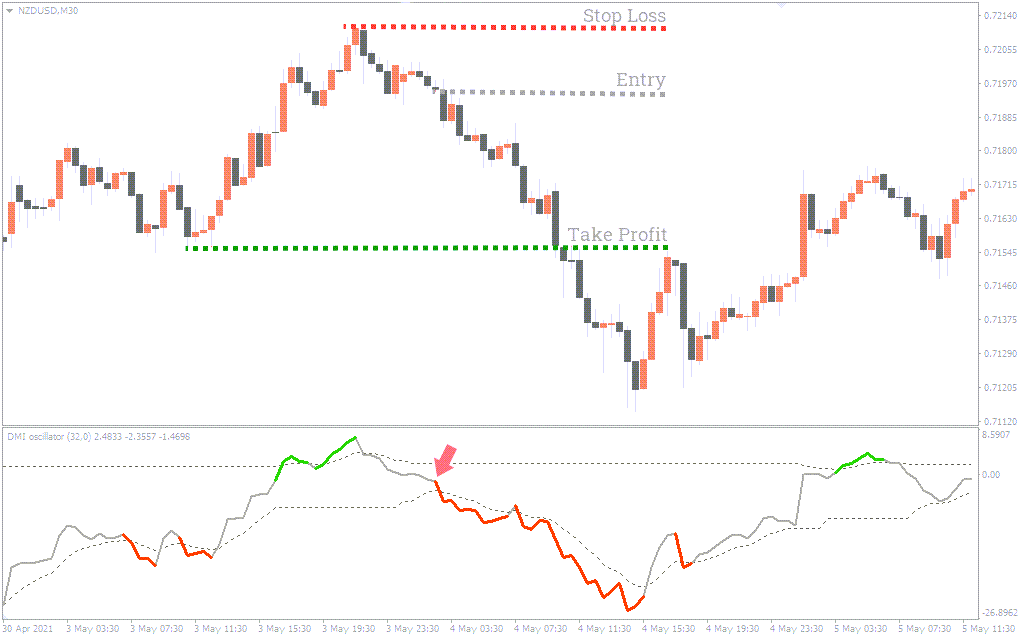
- Wait for the indicator color to get red.
- Confirm the indicator value to be below zero.
- Wait for a bearish candle to close.
- Enter the short trade with stop-loss around recent swing high. Place the profit target at next support level.
Conclusion
The DMI indicator may play a significant role in your technical analysis of the market. However, the tool shouldn’t be considered a standalone way to trade. You should wisely mitigate your risk and use other tools to confirm your entries.