
Mega Trend Indicator
Easy to use Mega Trend indicator for trend trading. An excellent trend reversal detector and incredible buy and sell signals.
Description
If you have been trading the Forex market for any length of time, you are probably very familiar with the moving average (MA) trading indicator. The Mega Trend indicator is a largely improved type of moving average indicator. If you haven’t used MA before, don’t worry. We will explain everything you need to know about the Mega Trend Indicator for MT5.
About the mega-trend indicator
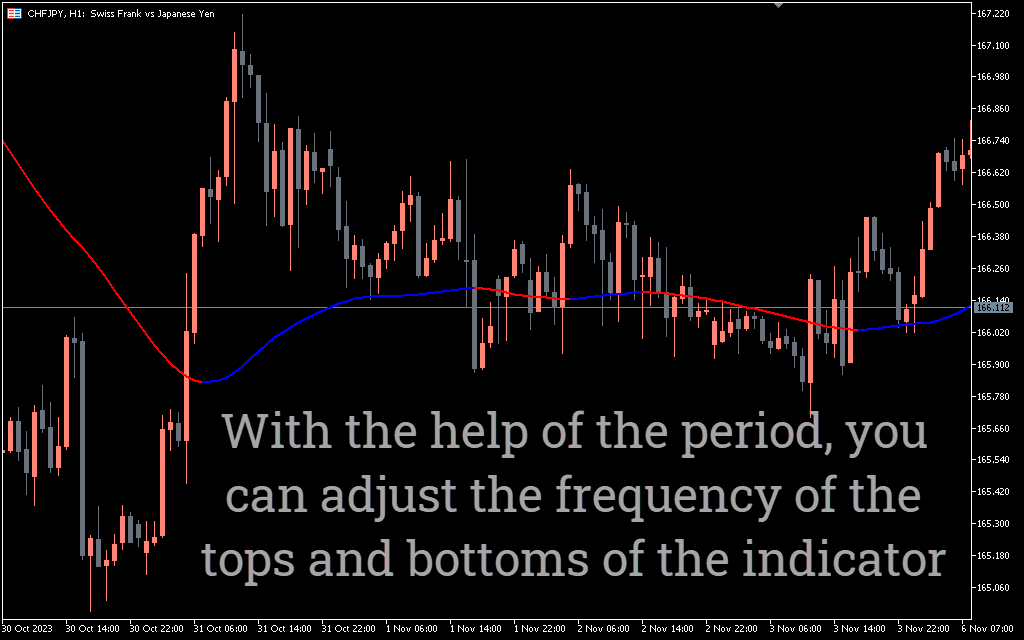
As mentioned, the megatrend indicator is a variant of the moving average that shows ideal reversal points. Traders mainly use the indicator to receive buy/sell signals. However, you can use it as a price filter. The default period is set to 144. While this value is great for identifying long-term price movement, it slows down the indicator. If you are trading on a short-term basis, you will need to speed up the indicator by using shorter periods.
The indicator is ideal for trend, price action and reversal trading. You can use the Mega Trend indicator on any time frame from one minute (M1) to a month. Additionally, it supports both long-term and short-term trend analysis. Thus, it is an ideal technical tool for scalping or intraday trading.
Buy and sell signals
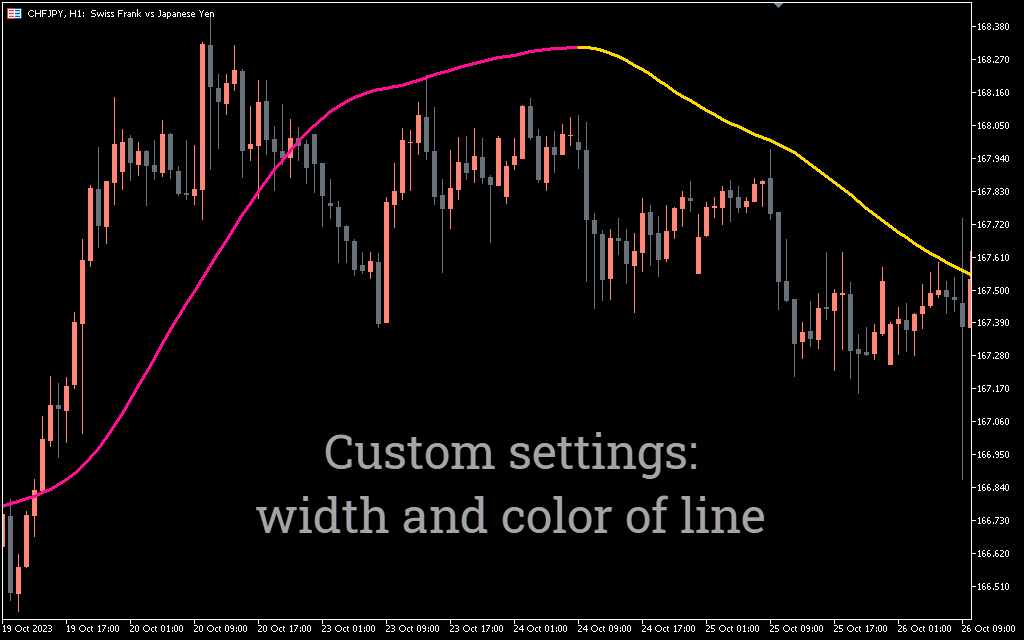
Using the Mega Trend indicator for MT5 is easy and simple. Simplicity is perhaps its best characteristic. The indicator line changes color to indicate the direction of the market. To give you a clearer idea, the line changes color from red to blue, indicating a bullish signal. When the line changes color from blue to red, it is a bearish signal.
Opening buy positions
Buy when the Megatrend indicator changes from red to blue. Set your stop loss at the most recent support level. You can also exit the trade when the line turns red again.
Sell signal
Enter a sell position when the line changes from blue to red. The ideal stop loss should be above the recent resistance level. Alternatively, you can exit if the indicator turns blue.
Example diagram
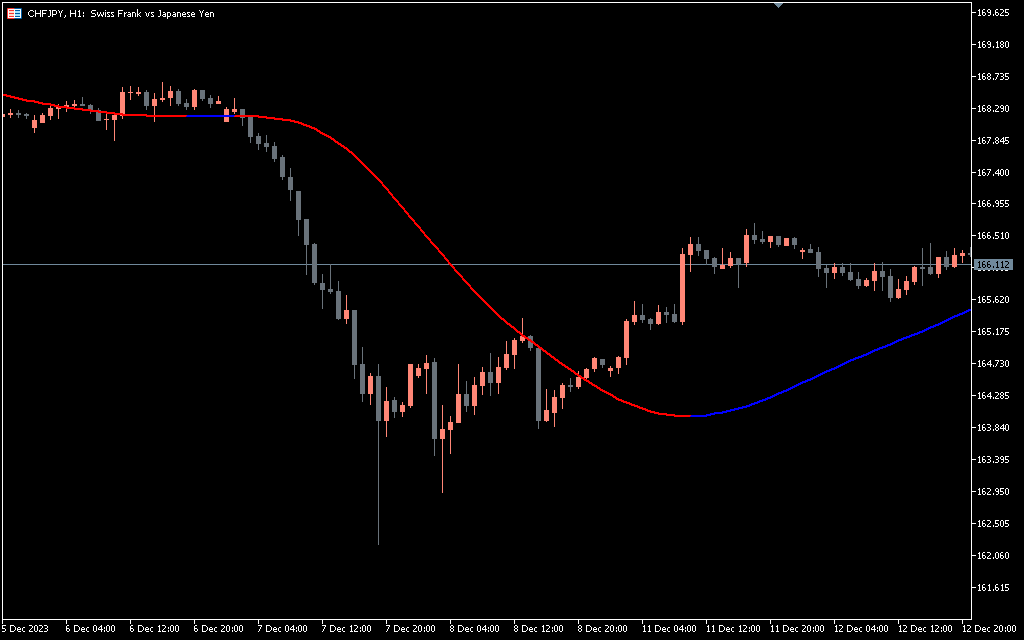
The screenshot above shows the price movement on the hourly timeframe (H1) for the CHF/JPY chart. The downward trend will begin at 21:00 on Dec 6th. The price fall from 168 and reached consolidation on Dec 7. The indicator changes color from red to blue around 164. This is an excellent price reversal indicator. This is also a great place to open a buy position. According to the indicator, the price returns to the previous resistance level.
Likewise, the line changes from red to blue when the price starts moving up. In fact, after the color change, the price went up 50 points. This makes the indicator an ideal tool to complement your trading strategy.
Easy to use indicator
The Mega Trend indicator is one of the simplest indicators. You just need to check when the line changes color from red to blue to enter a buy position and vice versa. Its simplicity makes it user-friendly and therefore a convenient tool for novice traders.