
Brain trend Indicator
Forex BUY and SELL signals from the best Brain trend Indicator for MT4. Find out the exact trend’s direction.
Description
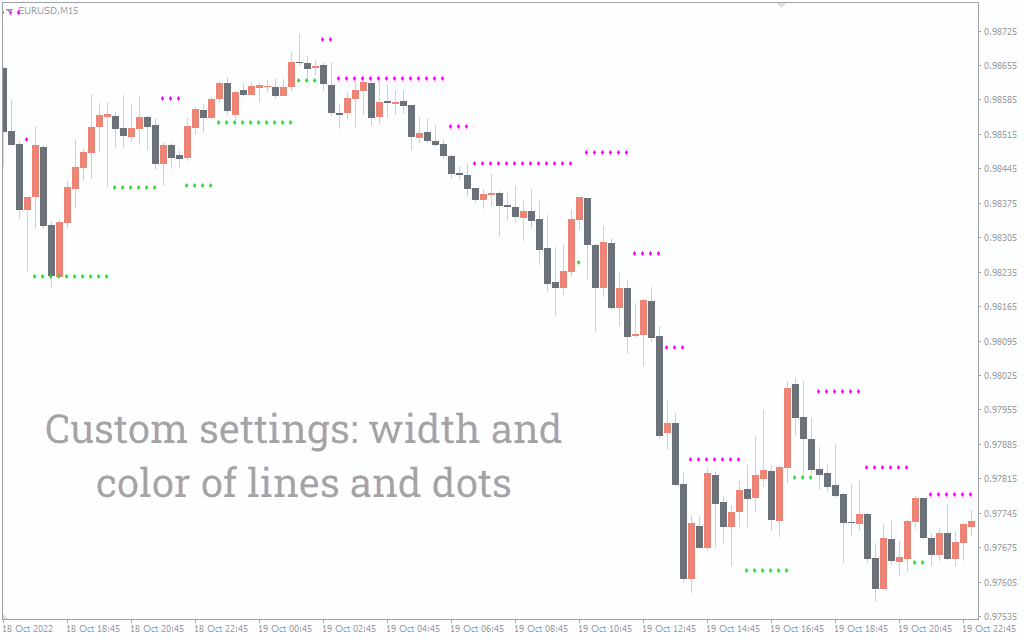
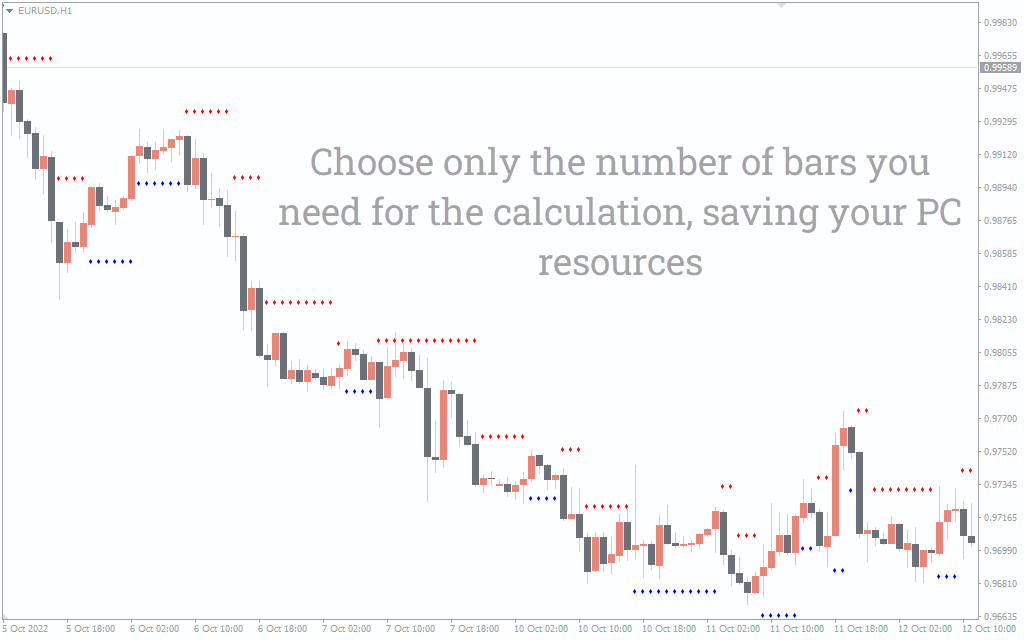
The Brain trend Indicator is a simple MT4 indicator that tells about the trend’s direction. The indicator plots dotted lines to mention the trend’s direction. Whenever there is a bullish momentum, the indicator draws blue dotted lines. Conversely, the indicator plots red dotted lines when there is a bearish momentum.
The dotted lines act as levels of support and resistance. The red lines mark resistance levels, while the blue lines highlight support levels. Traders can use the Brain trend Indicator on any timeframe, but it’s best to use it on higher timeframes to avoid any market noise.
Brain trend Indicator for MT4 BUY/SELL signals
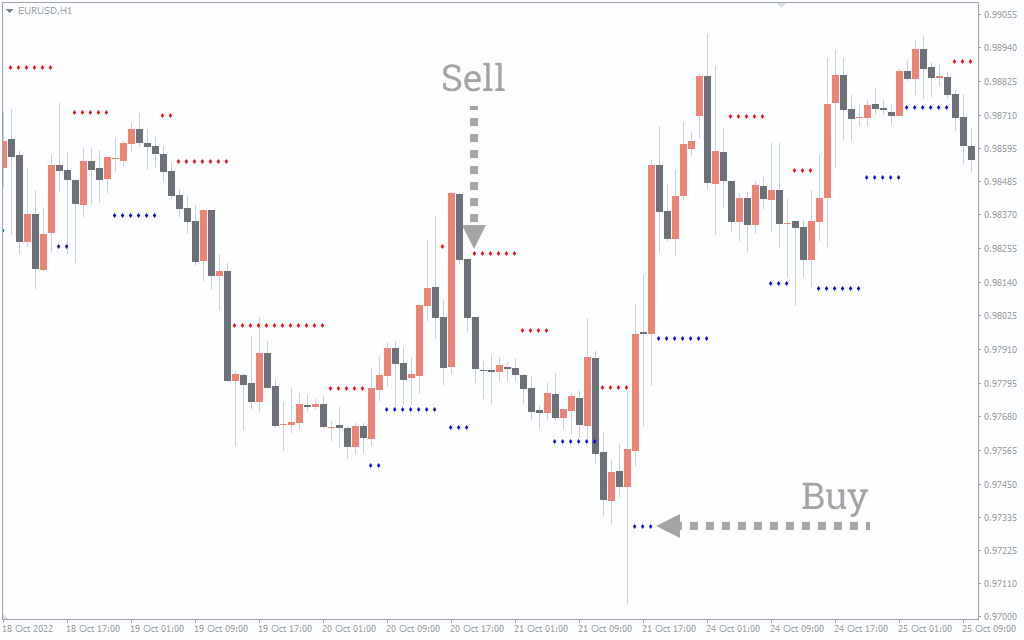
The above EUR/USD H1 chart shows the BUY and SELL signals for the Brain trend Indicator . To determine BUY and SELL signals, traders must look at the red and blue dotted lines, aka support and resistance levels. Whenever the indicator plots blue dotted lines, traders can take long positions or exit the short ones. Conversely, traders can go short or exit long positions when the indicator plots red dotted lines.
Traders need to wait for confirmation before entering the trade. For instance, if the Brain trend Indicator marks blue dotted lines, and the next candle is bullish, traders can take BUY positions. When the price moves like that, it indicates that the price is still respecting the support region but also beginning to go higher off of support. Selling at resistance follows the same logic. Wait for a minor consolidation at the red dotted lines (resistance) before entering a short trade when the price falls below the low of the small consolidation.
It’s important to remember that the Brain trend Indicator plots red dotted lines in an uptrend and blue dotted lines in a downtrend. So, it mentions a trend reversal. It’s important to remember that the Brain trend Indicator can produce false signals. So, traders must combine other indicators with the Brain trend Indicator to enter positions.
In addition, there can be many false breakouts when trading with the Brain trend Indicator . One method is to wait for a false breakout and then enter the market. For example, if the trend is up and the price is drawing back to the blue dotted line (support), wait for the price to break below support before buying when it begins to recover above support.
Similarly, if the trend is down and the price is drawing back to red dotted lines (resistance), wait for the price to break above resistance before short-selling when it begins to fall below resistance.
Conclusion
The Brain trend Indicator for MT4 draws red and green dotted lines to determine the trend’s direction. Traders can use it to find exact entry and exit points. Also, it tells about market reversals. You can also download the indicator for free on our website.