

Donchian Bands Indicator
Forex market trends from the best Donchian Bands Indicator for MT4. Find the trend’s direction with the help of the Donchian Channel.
Description
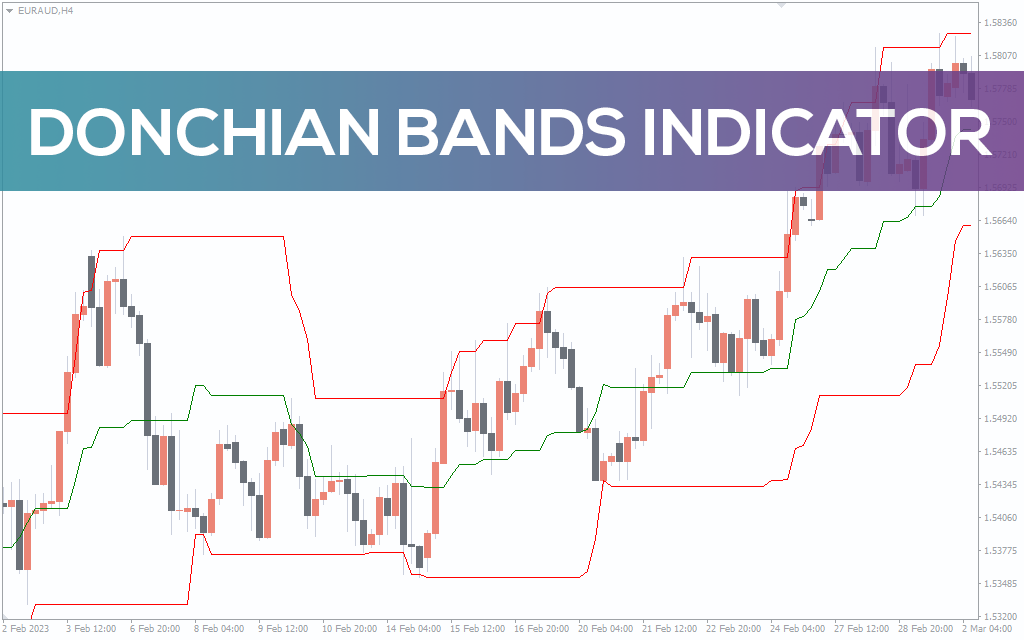
The Donchian Bands Indicator is a customized version of the traditional Donchian Channel indicator. It uses three moving average lines to form a band over the price. These lines are the upper, lower, and middle lines.
The indicator resembles the traditional Donchian channel, where the upper and lower bands tell about the trend’s direction.
Although the indicator is suitable for shorter timeframes, it’s better to look for the trend on longer timeframes.
How to use the Donchian Bands Indicator for MT4?
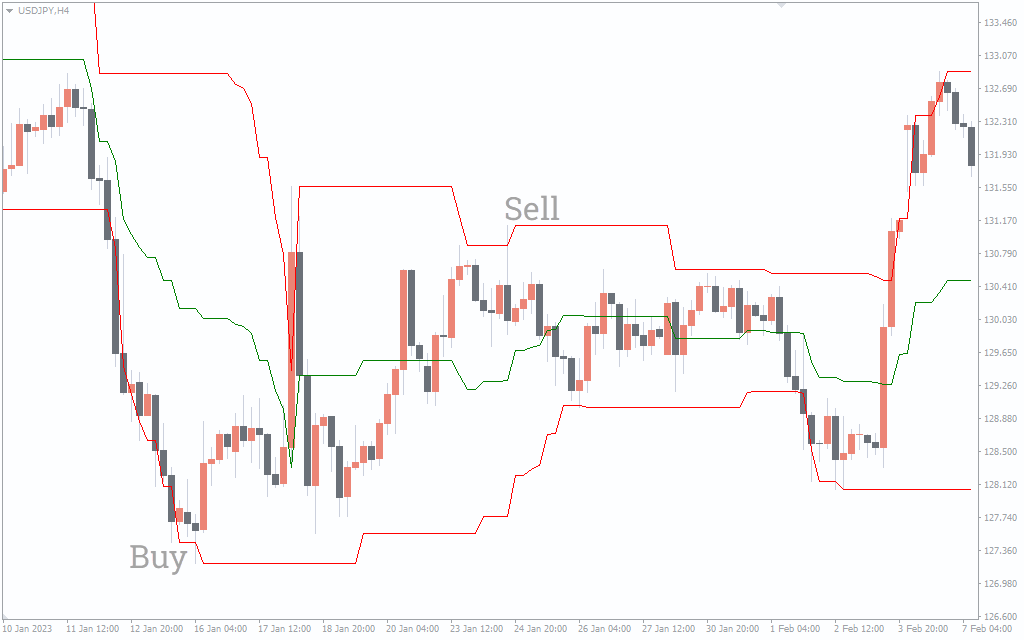
The above USD/JPY H4 chart shows the indicator BUY/SELL signals.
To find the trading signals, the price must break above the upper and lower bands. If the price breaks above the upper band, it signifies a bearish reversal, and you can go short. The upper band can also act as a resistance level.
On the other hand, if the price breaks below the lower band, it shows a bullish reversal, and you can go long. The lower band can also be looked at as a support level.
The middle band act as a neutral level, and if the price is far away from it, this means a strong trend.
The indicator works fine on its own, but it may not work properly in choppy markets. So, you can include additional indicators like the RSI or MACD for signal confirmation.
Conclusion
The Donchian Bands Indicator is a customized version of the Donchian Channel. It plots three bands, upper, lower, and middle. These bands tell us about the direction of the trend.