

Chande Momentum Oscillator Indicator
The ideal oscillator for determining momentum. The Chande Momentum Oscillator is an incredible Forex trading tool designed to spot strong trends and impending reversals.
Description
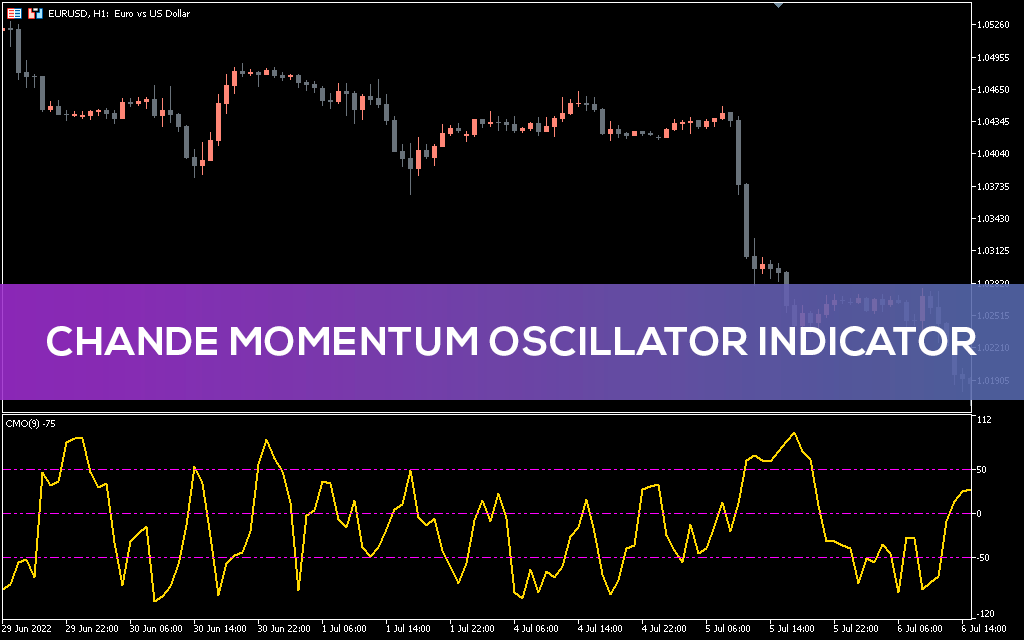
Chande Momentum Oscillator (CMO) is one of the technical indicators developed by Tushar Chande. He explores this technical indicator in his book Beyond Technical Analysis. The indicator measures momentum on up and down days without smoothing out the results causing more overbought and oversold breakouts. The whole idea is to use the indicator to open trades when momentum is strong.
How to read the Chande Momentum Oscillator indicator?
CMO fluctuates between +100 and -100. The instrument is considered overbought when the indicator is above the +50 level, and oversold when it is below -50.
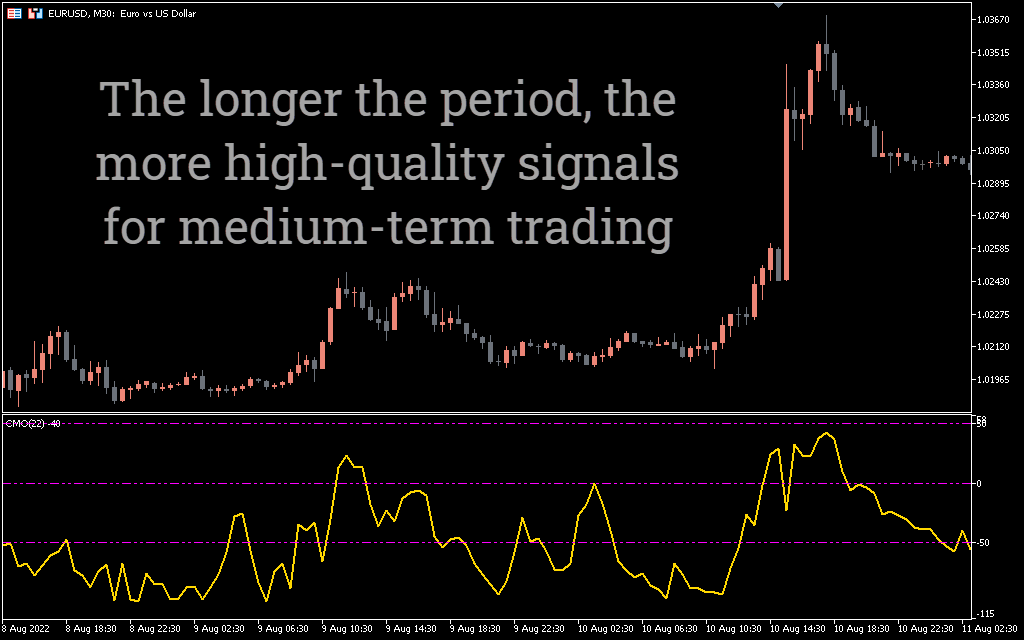
Here’s an interesting thing. You can use the Chande Momentum Oscillator to analyze any instrument and it works very well on any time frame. However, it works best when trading a trending market rather than a range market.
How to Use Chande Momentum Oscillator
Using the CMO indicator is simple. Start by determining the position of the indicator line. When the indicator rises above the zero line in a bull market, it means the trend is gaining momentum. Therefore, it is worth considering the possibility of opening a long position. Similarly, when the oscillator line drops below the zero line, it indicates an increase in bearish momentum and you should consider going short.
When the indicator reaches the +50 line, it enters the overbought zone. Therefore, you must be prepared for a trend reversal. The same case applies when the line reaches -50. But in some cases, the closer the indicator line is to +/- 100, the stronger the momentum. When the indicator line fluctuates around the O level line, it means that the market is in a range. Therefore, you should stay away.
So how do you know if strong momentum will continue or if the market will reverse? This is where the moving average comes in handy. This strategy involves building the MA on top of the CMO line. A bullish signal is confirmed when the indicator crosses the MA line above the line. Similarly, a bearish signal is confirmed if the indicator crosses below the indicator line.
Trading example
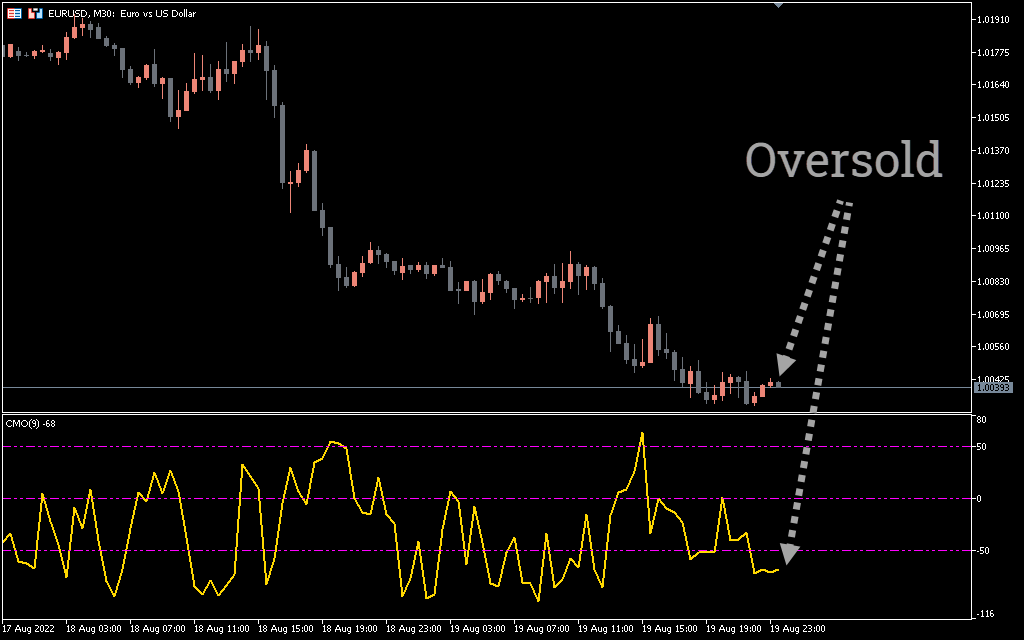
The picture above shows the price chart of the EURO against the US Dollar and the indicators for the same period. Notice how the indicator simulates the ups and downs of prices. The price has expanded to areas of interest (previous support). This coincides with the indicators hitting the overbought zone.
In this case, the momentum was quite high. But it will definitely come back. Therefore, the trader must be ready to enter a short position.
Conclusion
The Chande Momentum Oscillator helps traders determine the strength of market momentum. It is similar to the Relative Strength Index with overbought and oversold areas. When the indicator rises above the zero line, it indicates an increase in upward momentum during an uptrend. When the indicator drops below the zero line, it indicates increasing momentum in a downtrend. You can enable other momentum indicators to improve signal accuracy.