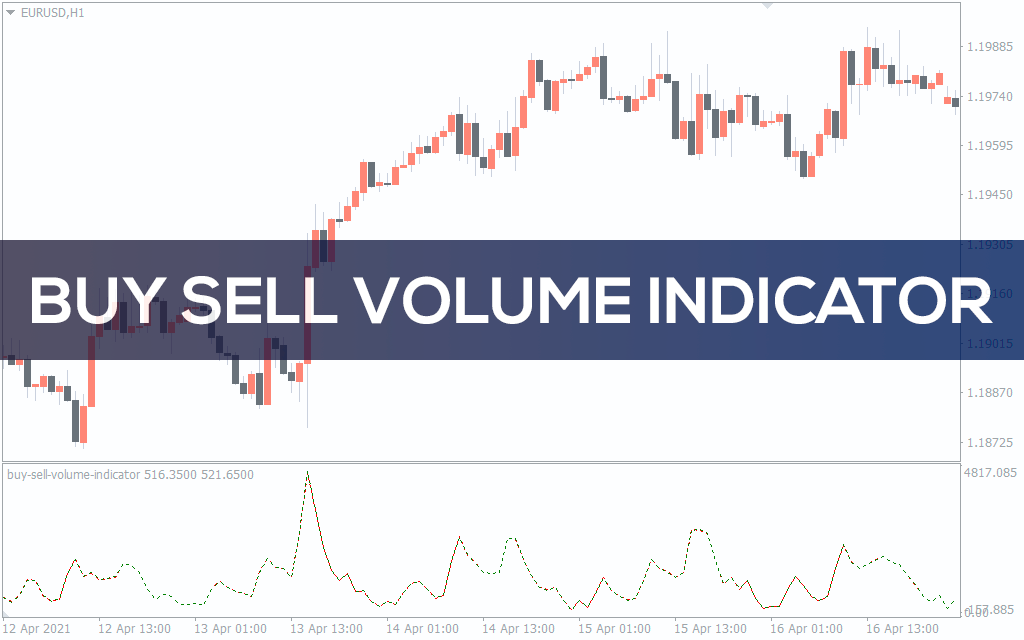
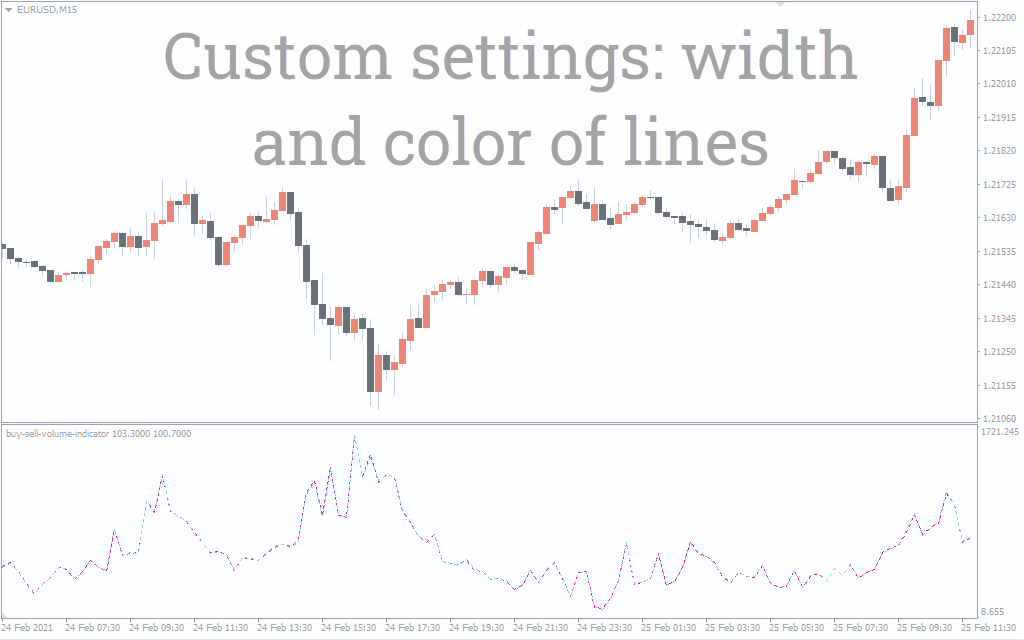
Buy-Sell Volume Indicator
Buy-Sell Volume Indicator offers the best volume-based trading solution for Metatrader 4 users. Works as an automatic trend filtering too for forex and stock trading
Description
The Buy-Sell Volume indicator determines the strength and weakness of price movements.
In the live market, we always intend to join a bullish or bearish move that shows better a strength in the background. There are many methods of measuring a trend strength. Volume is one key factor that traders consider to analyze the bullish and bearish force behind breakout and trend-following moves.
We also recommend exploring other powerful volume-based tools like the Volume MA Indicator and the Percentage Volume Oscillator. These indicators complement the Buy-Sell Volume tool and can enhance your volume analysis strategy by offering different perspectives on volume trends and momentum.
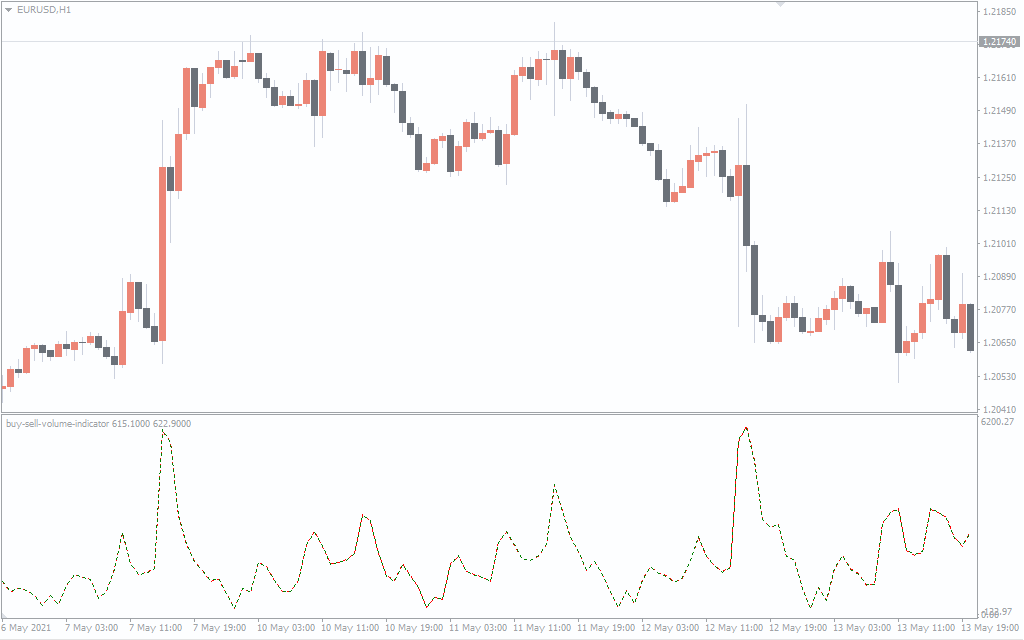
The buy-sell volume indicator continuously monitors the comparisons between the bullish and bearish force of the price. However, it doesn’t demonstrate a direct buy-sell signal. Instead, it helps you to filter and pick the best trade setup based on the volume strength.
This guide explains how the buy-sell volume indicator works and how to apply it for examining the strength of price momentums.
How to trade using the Buy-Sell Volume Indicator in the MT4 platform
The buy-sell volume indicator uses a dotted curve to show the increase and decrease in market volume. Also, the indicator level changes its color to confirm the bullish and bearish momentum. The indicator curve turns green when the volume keeps increasing.
We consider it as a sign of a potential bullish move. On the other hand, a red volume curve indicates that the asset’s trading volume is decreasing. In such a situation, we assume the price is possibly preparing for an upcoming bearish move.

In the above example, we’ve highlighted a consolidation period of EURUSD in a 15-minute chart. Initially, the currency pair was in a bullish move, so we expect the current sidelined condition will end up with a bullish breakout. During this period, the buy-sell volume curve was also coiling within a short-range.
Whenever the EURUSD makes a bullish breakout attempt the volume curve also rises and moves above its current consolidation range. Besides, the indicator level turns green confirming the breakout is happening with a positive volume force in the background.
In my trading, I always wait for volume confirmation before entering a breakout. This indicator has helped me avoid false breakouts more than once. A rising green curve gives me the extra confidence to commit to a trade.
For filtering a sell setup, make sure the volume curve turns red and shows a decreasing pattern. It is ideal to pick a selling opportunity when the price makes a bearish breakout and the indicator value drops at the same time.
Apart from breakout opportunities, it also helps in examining the trend-following trade setups. For instance, the price is in a bullish trend and plots a higher-low before rejoining the current bullish move. At the same time, the indicator level turns green and moves up. It means the asset is under strong buy pressure and it is time to go for a long entry.
Pros and Cons of the Buy-Sell Volume Indicator
 Pros
Pros
- Clear visual cues: The green and red coloring system makes it easy to spot bullish or bearish pressure at a glance.
- Breakout validation: Helps confirm whether a breakout is supported by sufficient volume, reducing false entries.
- Simple and lightweight: Doesn’t overload the chart with information, making it suitable even for beginners.
- Works on all timeframes: Effective across short-term scalping and longer-term swing setups.
- Complements price action: Ideal for traders who already use support/resistance or candlestick patterns.
 Cons
Cons
- No direct buy/sell signals: This is a filtering tool, not a standalone entry system.
- No sound/visual alerts: Traders must watch the chart to catch volume color shifts in real-time.
- Depends on broker volume data: Accuracy can vary depending on the quality of tick volume provided by your MT4 broker.
Conclusion
Volume is an important technical indicator for both forex currency pairs and stocks. Because it gives you a practical overview of buy-sell demands of the trading assets. For technical analysis, finding the correct volume result is also a crucial fact.
In my experience, combining this indicator with price action techniques like support/resistance and candlestick patterns creates a very reliable strategy. It doesn’t repaint and gives early clues about volume exhaustion or strength.
As per our in-depth review, the buy-sell volume indicator is simple, effective, and user-friendly, especially for newbie traders.
Frequently Asked Questions (FAQ)
 Does the Buy-Sell Volume Indicator give direct buy or sell signals?
No, it doesn’t provide classic arrows or alerts for entries. Instead, it helps evaluate volume strength to support breakout and trend trades.
 Can I use this indicator on any timeframe?
Yes, it works on all timeframes, but it’s especially effective on M15, M30, and H1 charts for breakout detection.
 How does it compare to other volume indicators?
Unlike traditional volume bars, this indicator filters and smooths the volume data to give a clearer trend of buy vs. sell pressure.
 Is it beginner-friendly?
Absolutely. With only two color cues (green and red), even beginners can make informed decisions based on volume dynamics.
 Can this be used for stocks and crypto as well?