Automatic Channel Indicator
Automatic Channel indicator is a great tool to find resistance and support areas on your chart. You can use the tool as a trade setup.
Description
If you are trading for a while, you might have heard of trend channels. They are famous for predicting price, and they also help traders find potential support and resistance zones. Drawing trend channels could be tricky, but an Automatic Channel indicator solves the problem.
What is the Automatic Channel indicator?
Trend channels reveal the ongoing trend, strength of a trend and its maturity. Usually, traders draw a channel using the equidistant channel feature of a trading platform or using the trendlines. However, another type of channel is more advanced and draws five parallel lines automatically on your chart.
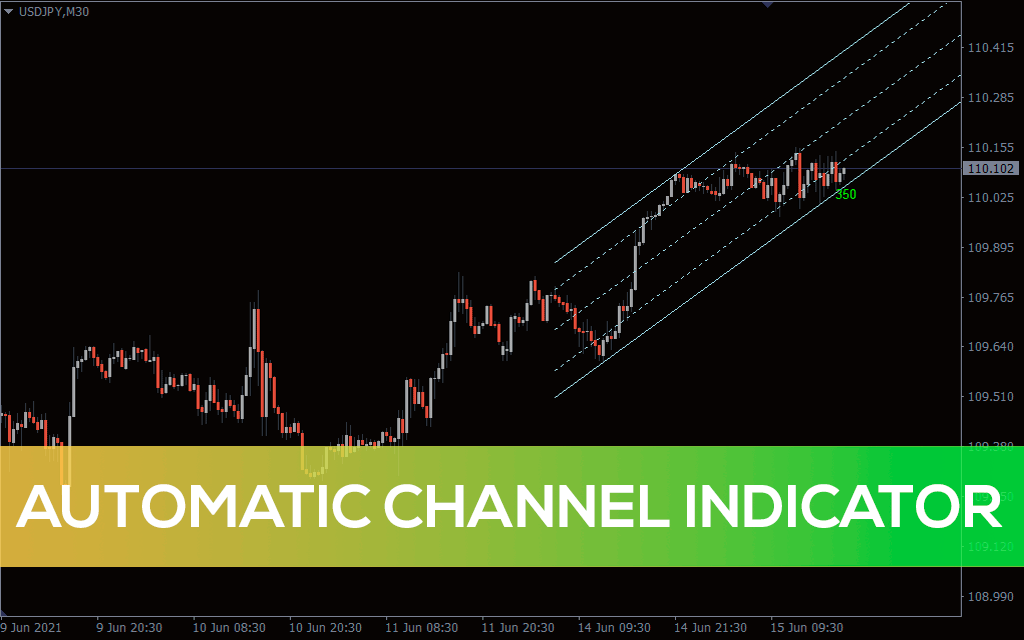
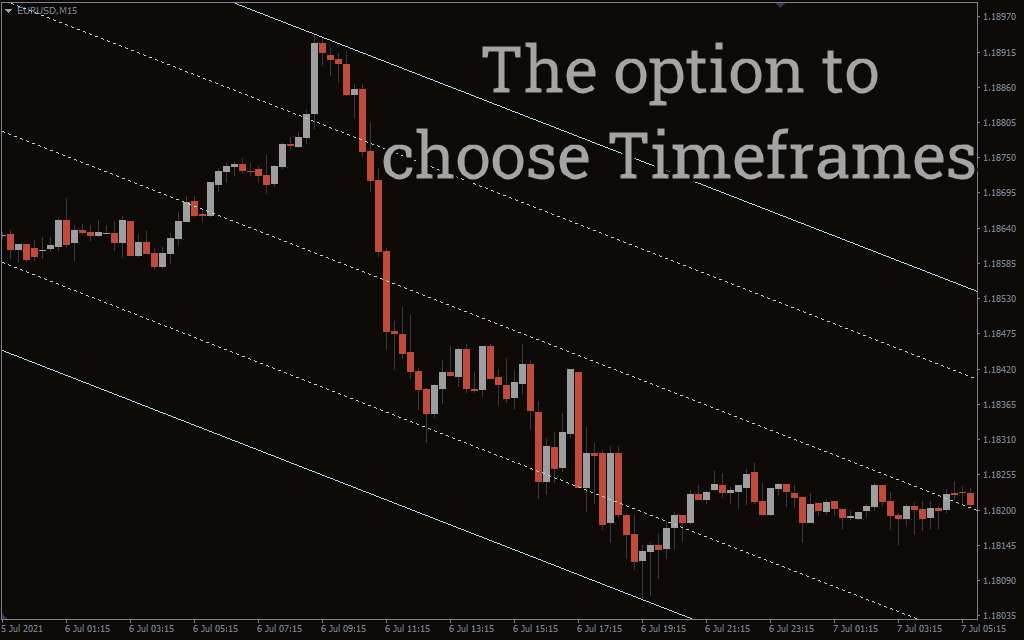
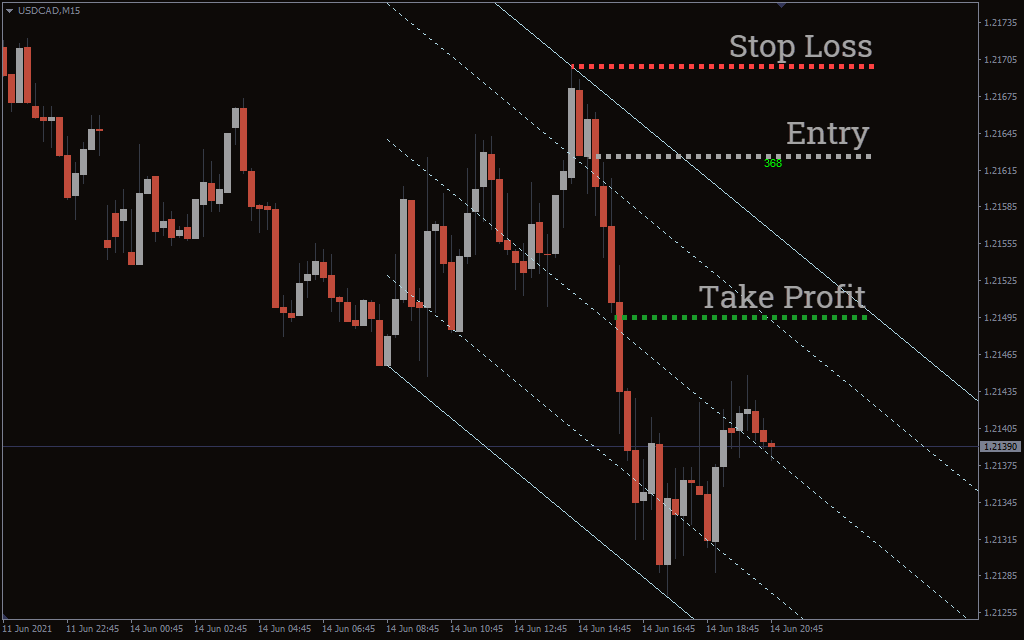
The Automatic Channel indicator draws a broad channel within which an interior channel appears with a mid-line that intersects the borders of a broad channel from the center.
These parallel lines act as potential support or resistance zones depending upon the relative position of price. A trend is considered mature and near reversal, if the price reaches the channel boundary.
How to use the Automatic Channel indicator?
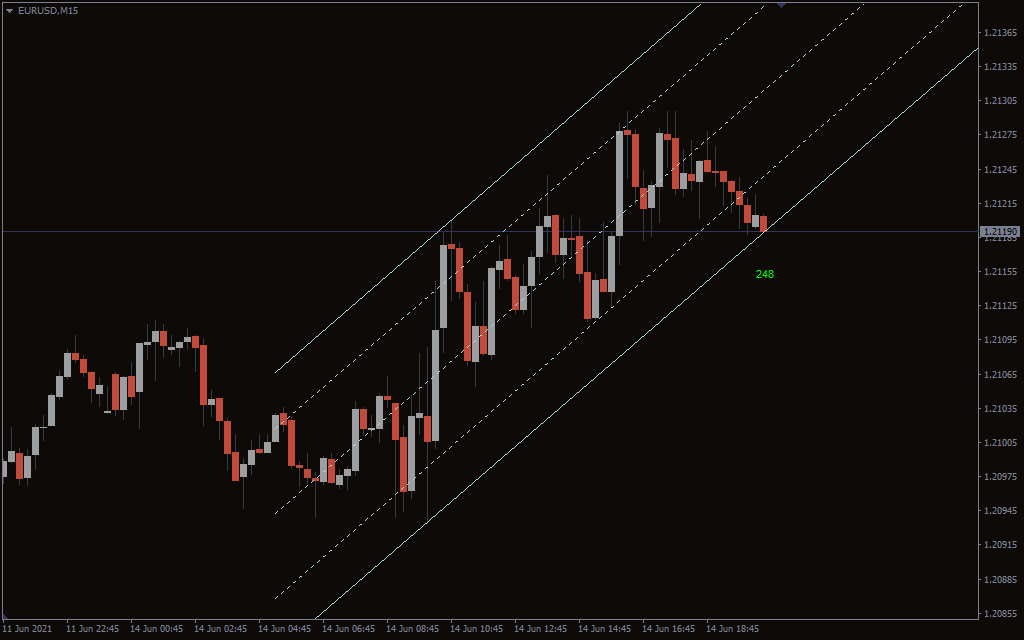
There are several ways to use the Automatic Channel indicator. The foremost utility of the indicator is to tell you where the price can halt because of support or resistance. For example, if the price is in an ascending channel, you will see the parallel lines pointing upside.
These lines will act as resistance if the price is below the lines. If the price lies above the lines, the levels will act as support. The mid-line acts as a pivot for a running trend. If the price drops below the mid-line in an ascending channel, we consider the trend is weakening.
You can use the indicator as a trading strategy as well. You can either trade reversal or breakout depending on several technical factors.
Automatic Channel indicator strategy
Now, let’s try to find a simple trading strategy based on the indicator.
Automatic Channel buy setup
- The price should reach the lower boundary of the channel.
- Wait for price rejection near the channel line.
- Enter long once the bullish candle
- Place the stop-loss slightly below the low of the rejection candle.
- Place the take profit near the mid-line or the next parallel line depending upon the strength of a bullish trend.
Automatic Channel indicator sell setup
- The price should reach the upper boundary of the channel.
- Wait for price rejection near the channel line.
- Enter short once the bearish candle
- Place the stop-loss slightly above the low of the rejection candle.
- Place the take profit near the mid-line or the next parallel line depending upon the strength of a bearish trend.
Automatic Channel indicator conclusion
The Automatic Channel indicator places five parallel lines on your chart to help you find potential support and resistance zones. You can use these lines to enter or exit your positions. Although the indicator is quite useful but you should not blindly use it. Instead, apply it in conjunction with any other trend tool to enhance your win rate.