WLX Fractals Indicator
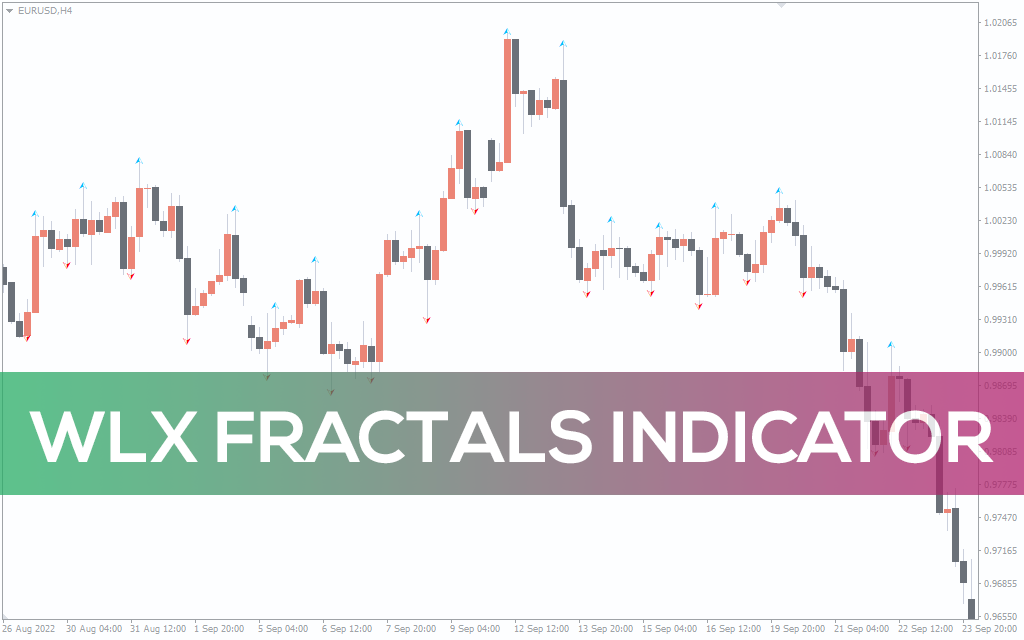
The WLX Fractals indicator draws arrows on the chart to tell you the direction of the current bar.
Description
The WLX Fractals indicator is a simple indicator that tells you the direction of the bar.
Bill William developed the Fractal indicator to point out reversals in the market. WLX Fractal follows the same pattern and tells you where the market is heading.
Fractals do pop up when there’s a shift in market pattern. Fractals point out an upward momentum when the market is in an uptrend. Conversely, when there’s a downtrend, Fractals point out a downward momentum.
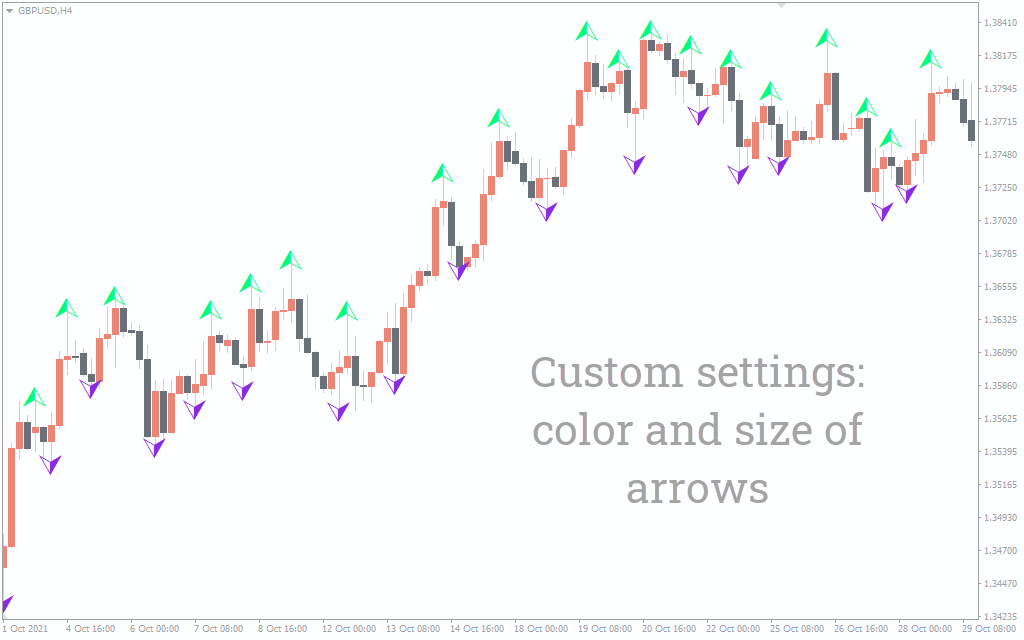
Like any other William Fractal indicator, the WLX Fractals indicator paints arrows on the chart to display Fractals.
The indicator takes the hassle off as it points out entry and exit points. When there’s a blue arrow, you can go short, while you can go long when there’s a red arrow.
How to trade the WLX Fractals indicator?
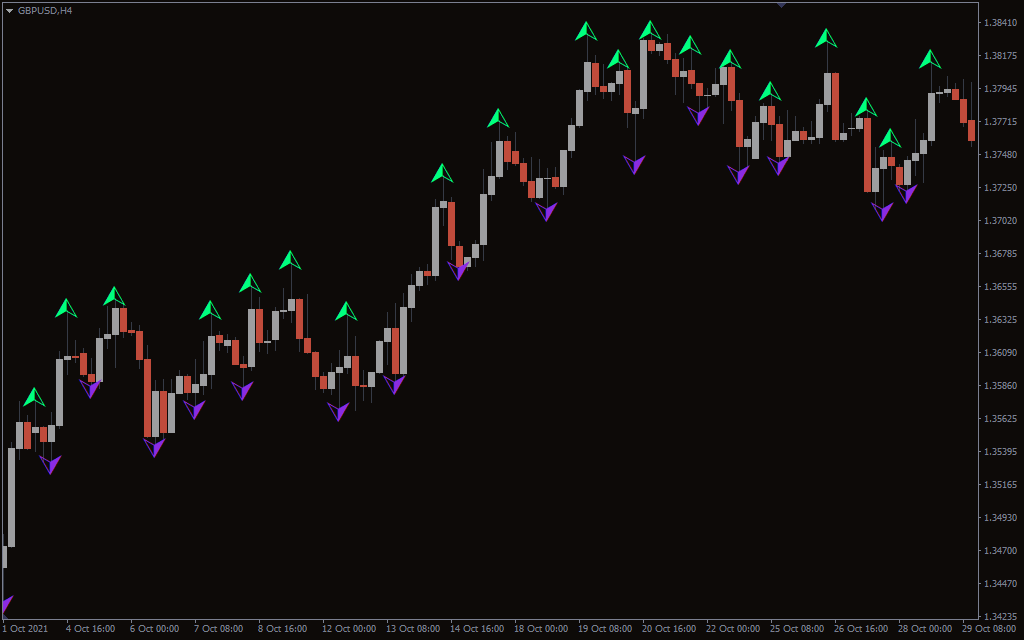
By plotting arrows on the chart, the VLX indicator presents where the trend is heading. The indicator comprises two arrows up and down. The two arrows are further divided into left and right.
These arrows illustrate the current state of the trend. Whenever the red arrow pops up, it presents a good buying opportunity. On the other hand, the blue arrow describes bears are winning, and you can take short positions.
It’s important to remember that sometimes the indicator can paint two successive arrows of different colors. So, it’s important to wait for a trend to fully occur and then take positions.
When looking for the signals, you should apply the indicator on longer timeframes, as the WLX Fractals indicator is prone to false signals on shorter timeframes.
Let’s find out the buy and sell strategy for the indicator:
WLX Fractals indicator buy strategy
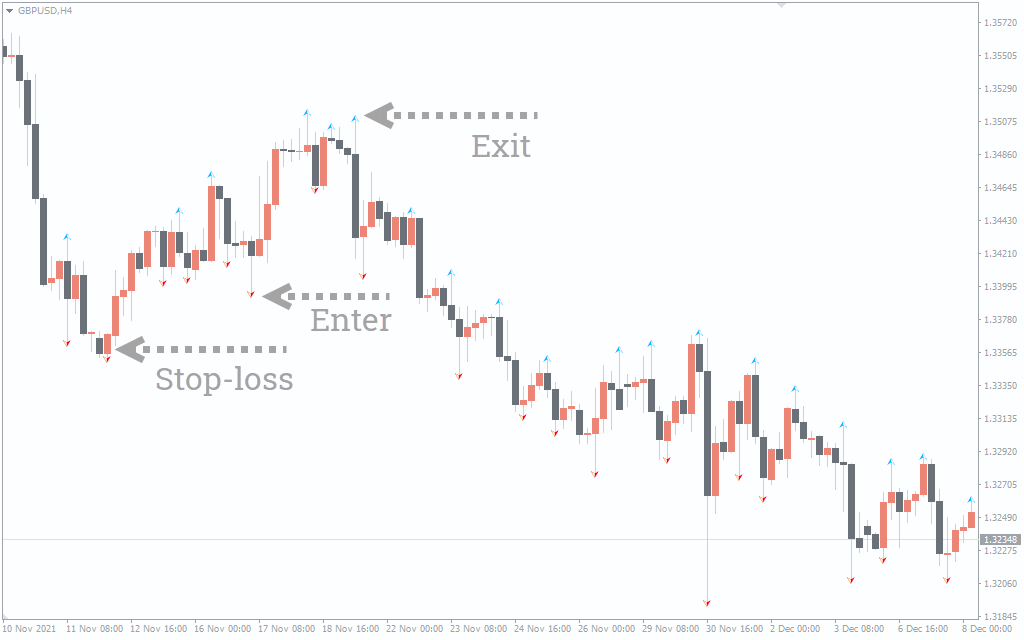
- The indicator should plot a red arrow on the chart.
- Wait for the trend to fully develop before entering.
- Enter the trade when the red arrow appears or after it.
- Place a stop-loss near the recent low of the buying point.
- Exit the trade when the blue arrow emerges.
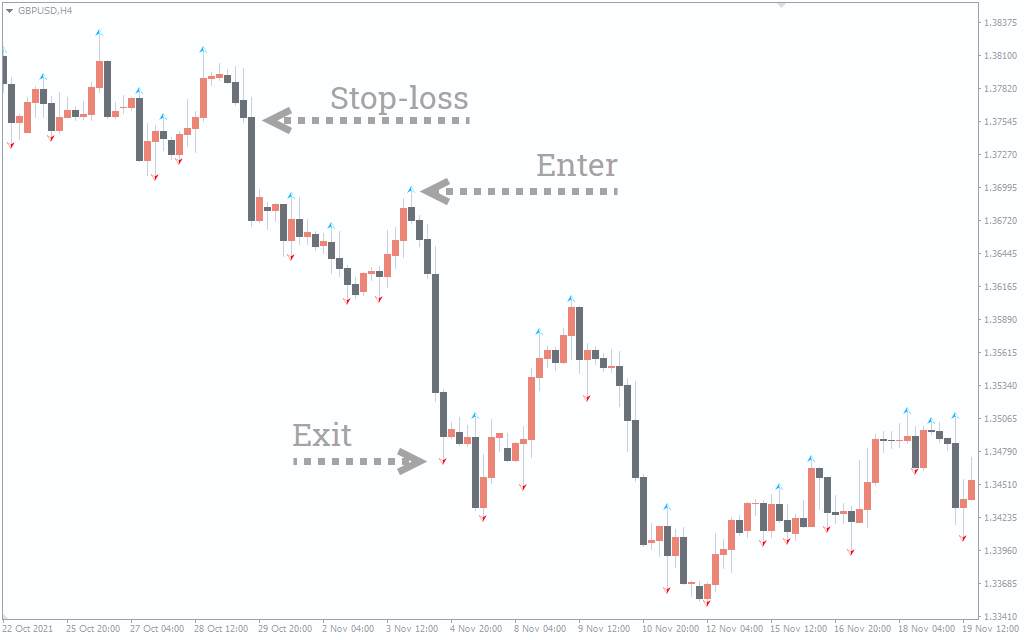
WLX Fractals indicator sell strategy
- The indicator should plot a blue arrow on the chart.
- Wait for the trend to fully develop before entering.
- Enter the trade when the blue arrow appears or after it.
- Place a stop-loss near the recent low of the buying point.
- Exit the trade when the red arrow emerges.
Conclusion
The WLX Fractals indicator is a simple indicator that presents you with the direction of the trend. The indicator can work on its own, but for further signal confirmation, you can apply other indicators like the RSI or MACD.