
Supply and Demand Daily Indicator
Identify key daily supply, demand, and equilibrium zones with automated MT4 indicator to anticipate reversals and breakout opportunities.
Description
The Supply and Demand Daily indicator for MetaTrader 4 is a powerful market structure tool from the LuxAlgo suite, designed to automatically detect and visualize key institutional zones. These areas represent price levels where large volumes of orders have previously caused significant market reversals. By mapping them in real time, the indicator gives traders the insight needed to anticipate high-probability reversals, retests, and breakouts. It’s particularly useful for intraday and swing traders who want to stay aligned with institutional order flow.
Supply and Demand Daily Trading Signals
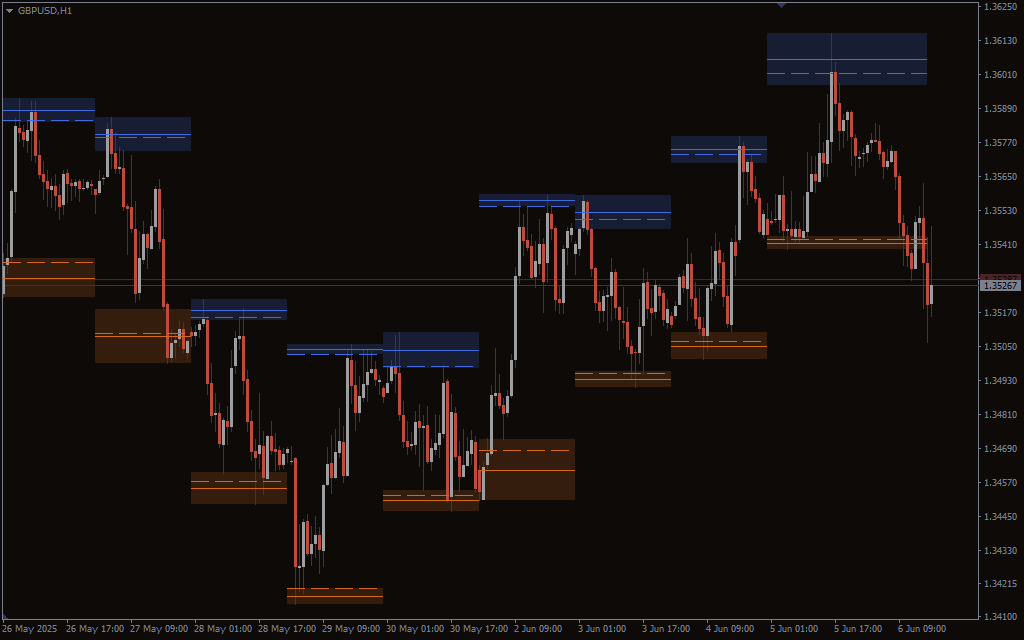
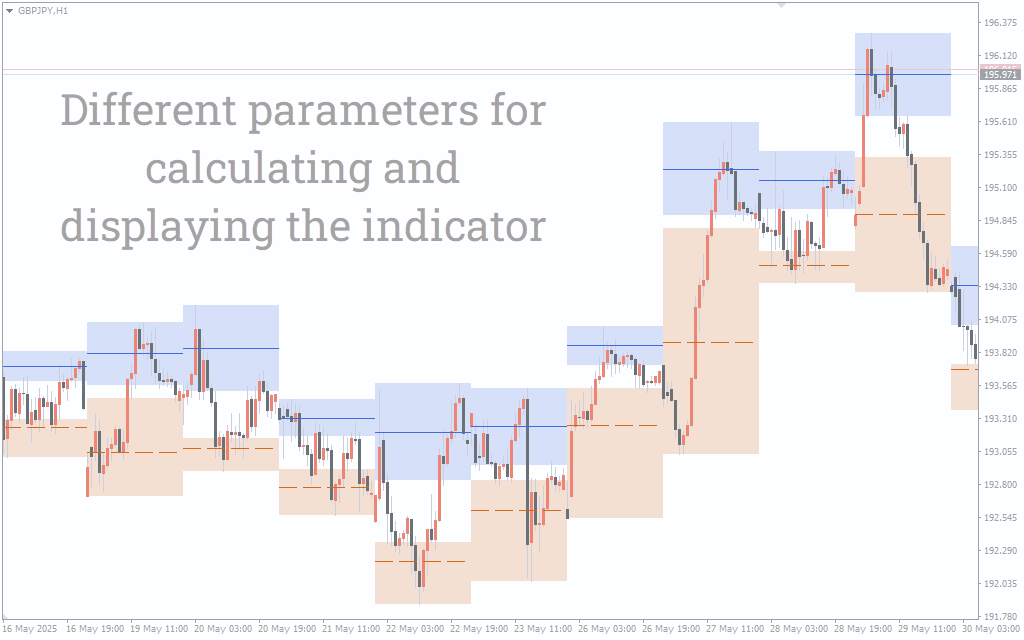
The indicator generates signals by plotting colored zones above and below the price, representing active supply (resistance) and demand (support) regions. When price enters a blue supply zone and fails to break higher, it often signals a potential reversal to the downside. Similarly, interactions with chocolate-colored demand zones may precede a bounce or rally. These levels are calculated using volume concentration and price interaction thresholds, making them reliable zones for planning entries, stop-loss placements, or exits.
Additionally, the tool marks equilibrium areas in gray where price has historically stabilized, allowing for neutral bias or range-trading strategies. Average and weighted levels within each zone provide further clarity, helping traders determine which areas are more significant.
Conclusion
The Supply and Demand Daily Indicator by LuxAlgo offers a refined, automated approach to identifying institutional price zones with precision and clarity. Its layered insights—including equilibrium, averages, and weighting—provide a deep edge for those looking to base their trading on where the big players operate. Whether used alone or alongside other tools, it brings structure, consistency, and confluence to your trading plan.