
Starc Bands Indicator
MT4 Volatility indicator. Trend reversal indicator for MT4.
Description
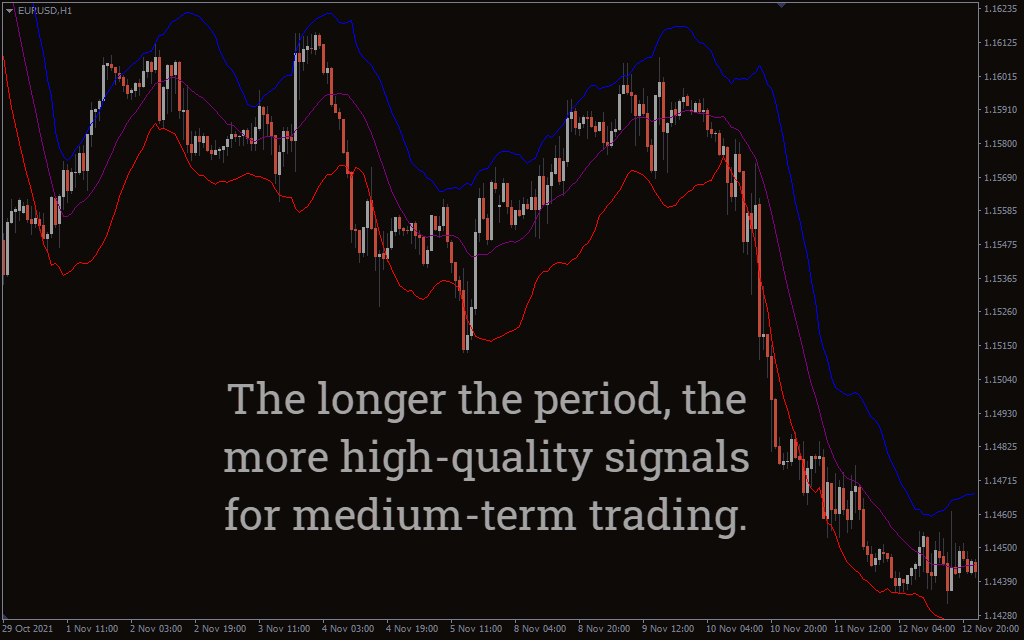
The Starc (Stoller Average Range Channels) Band indicator for MetaTrader is the best forex trading tool for trading trend reversals. This technical indicator has a similar semblance to the Bollinger Bands because it also encloses price within its boundaries.
The Starc Bands indicator has three bands. The upper and lower bands are made from simple moving averages (SMA). The simple moving average is the foundation of this indicator. Both bands are then built by adding/subtracting the average true range (ATR) to the SMA. The ATR value is added to the SMA to form the upper band and subtracted from the SMA to form the lower band.
The indicator can come in handy in identifying levels that are most likely poised for reversal for optimal trade entry (OTE). It does all the technical analysis in the background and displays results on the chart thereby easing trading.This implies that both the new and experienced traders can benefit from this MT4 indicator.
The bands react to the market sentiment by contracting or expanding to the fluctuations of the inbuilt ATR. This in turn helps you to get a clearer perspective of both the upper and lower limits of price.
This valuable information of price limits can be harnessed to take high probability trade entries or exits. The Starc Bands indicator looks cool on the chart and is ideal for scalping, day/intraday, and swing trading.
Starc Bands Indicator BUY/SELL Signals
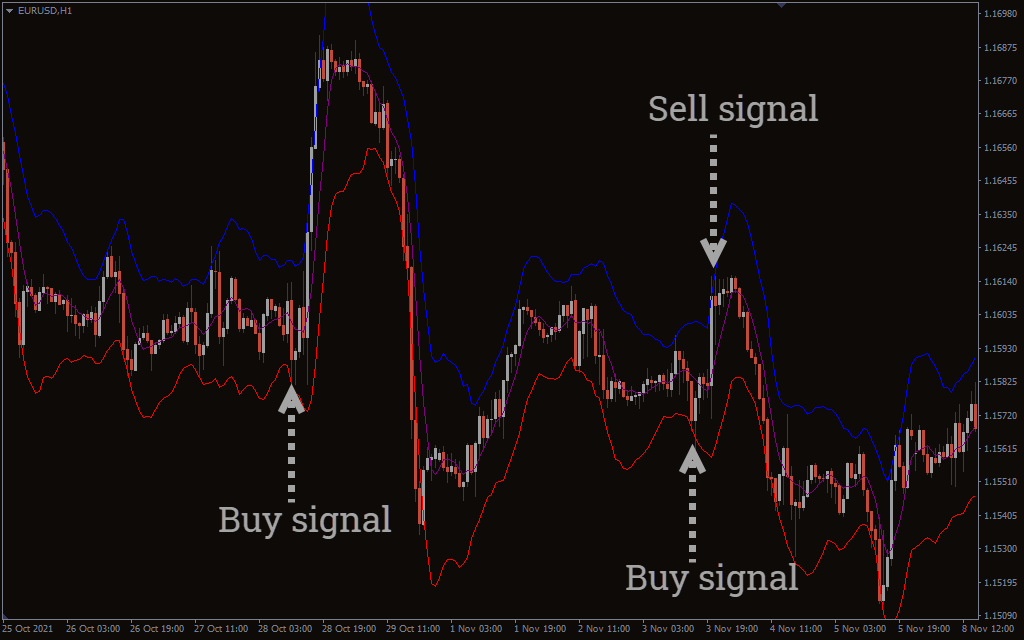
The picture above shows how the Starc Band indicator looks on a forex chart. You can use this indicator to take high probability winning trades with little knowledge of price action or in conjunction with other trading tools.
The Starc Band indicator for MT4 sets boundaries for price action with the upper and lower bands which act as overbought and oversold regions. The mid-band is to tell the direction of the trend – bullish or bearish. Price above the mid-band is bullish, and vice-versa.
When price touches the lower band, it’s an indication that price would most likely reverse to the upside, for instance. For a valid BUY opportunity, wait for the price to touch the lower band and show signs of strong rejection (long wick). You may consider opening a BUY/LONG position if the NEXT candle (after the first rejection) that closes is bullish (GREEN) and also shows signs of rejection.
The same principle is also applicable for a SELL signal. Wait for the price to hit the upper band of the Starc indicator with visible wick rejection to the downside. You may SELL/SHORT the asset if the NEXT candle that closes is bearish (RED) and also has a visible wick.
We aim to open a position only when we find an edge in the market. For example, the double wick rejections at the lower band are strong price action. Waiting for a bullish candle to form is a further confirmation that the market is willing to BUY. Furthermore, the indicator works best when used on higher time frames.
Conclusion
The Starc indicator for MT4 is a powerful forex trading tool that can significantly boost your winning trades especially when it is used rightly. The indicator is free to download so give it a try today.