

SR Levels Indicator
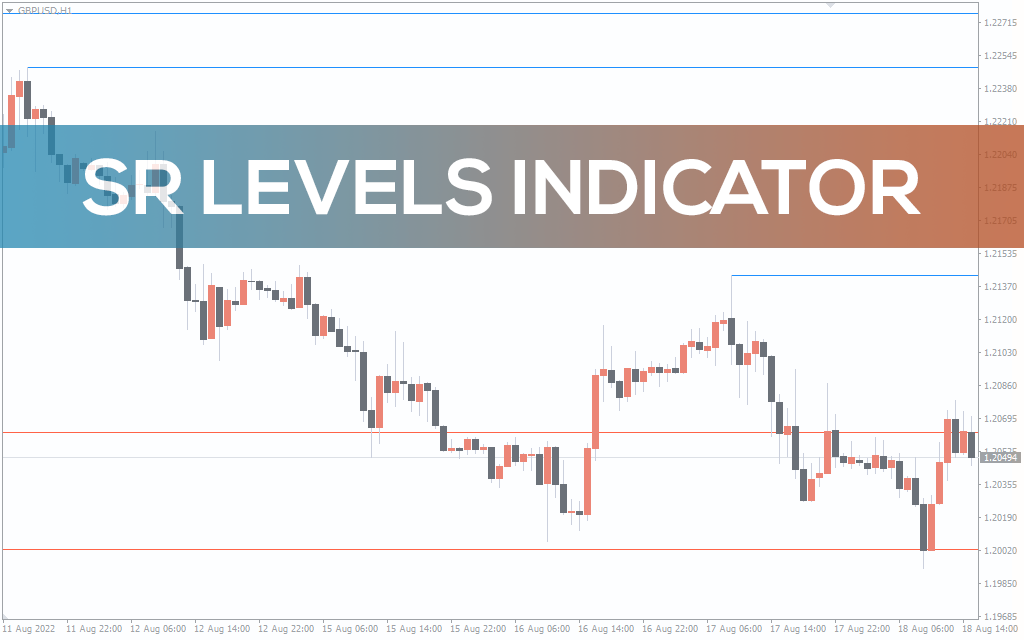
SR Levels Indicator is an ideal low and high detector. It shows the price where the rice is likely to reverse.
Description
In the trading world, the price tends to remember the previous area of interest. In other other words, the price tends to reverse after hitting a resistance or support level. Therefore, identifying support and resistance levels is crucial if you want to make profits in the market. This is where the SR Levels Indicator comes in handy.
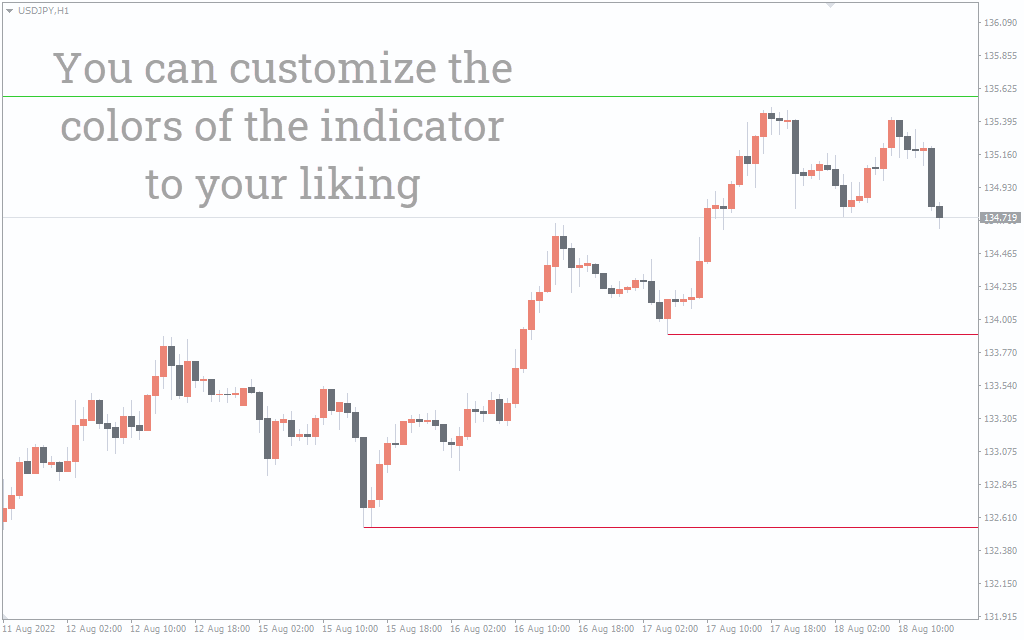
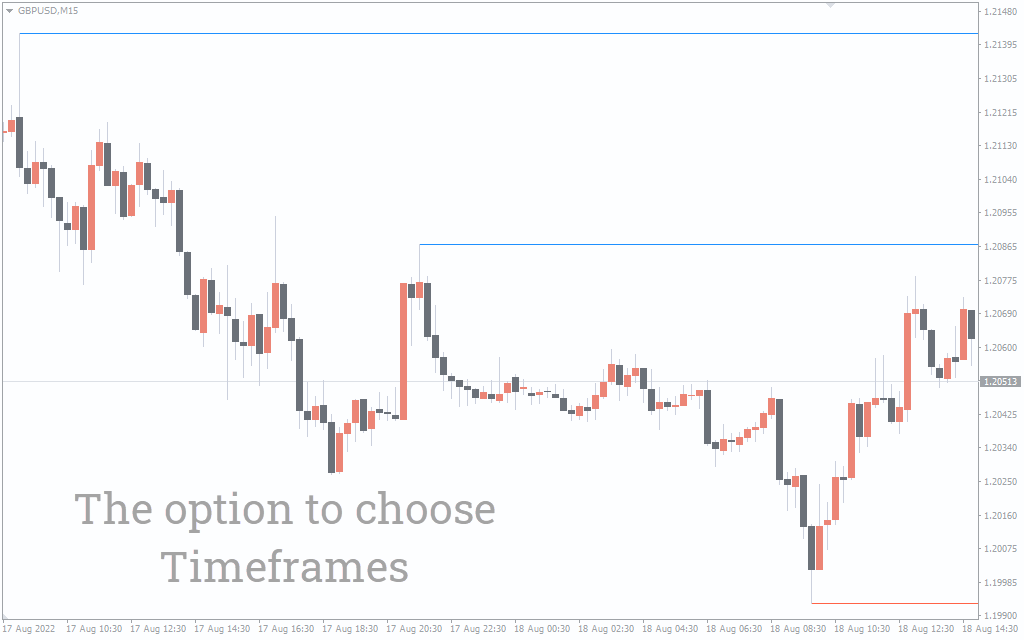
The support and resistance (SR) indicator shows the highs and lows of the market. You can use the indicator to analyze instruments on any timeframe.
How to Use the Indicator
As explained, the indicator does not provide buy and sell signals. It shows lows and highs in price action. You should be ready to buy when the price hits support and sell when it hits a resistance level. However, you should not use the indicator as a stand-alone indicator. You need other technical tools for market analysis and confirmations.
SR Levels Trading Example
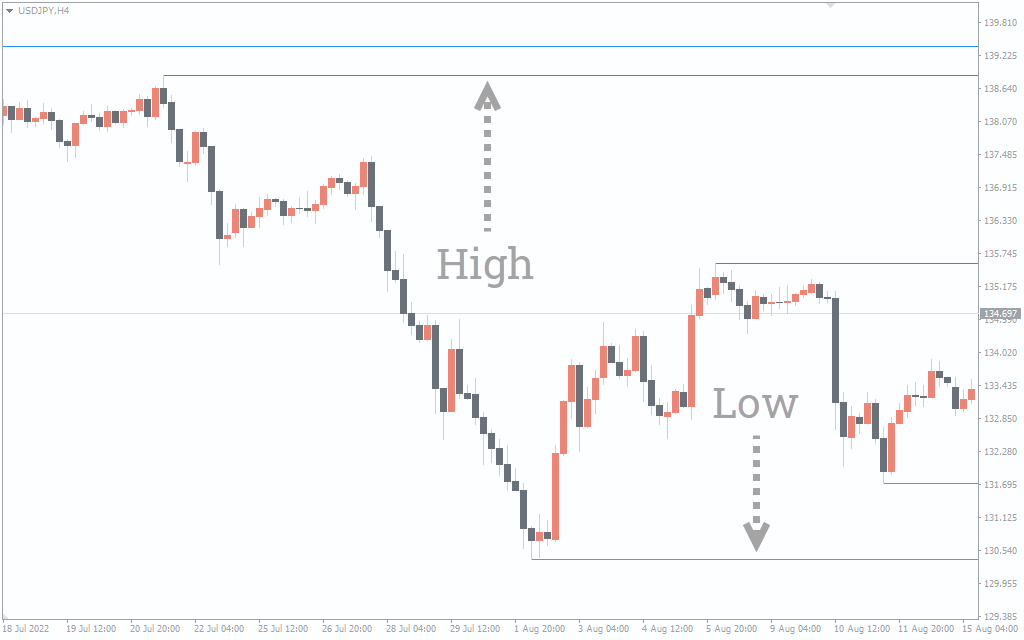
The chart shows the price action of the US dollar against the Japanese Yen in a four-hour time frame. The indicator draws highs that act as resistance and lows that act as support levels. You can therefore use other technical tools and patterns to identify reversal signals when the price hits this level.
Conclusion
The SR Levels Indicator is one of the ideal trading technical tools for detecting the resistance and support levels. The price will likely reverse when it hits previous lows and highs. You should therefore look for reversal signals when the indicator hits these levels. It is one of the most helpful tools you should have.