

RSI TMA Centered Bands Indicator
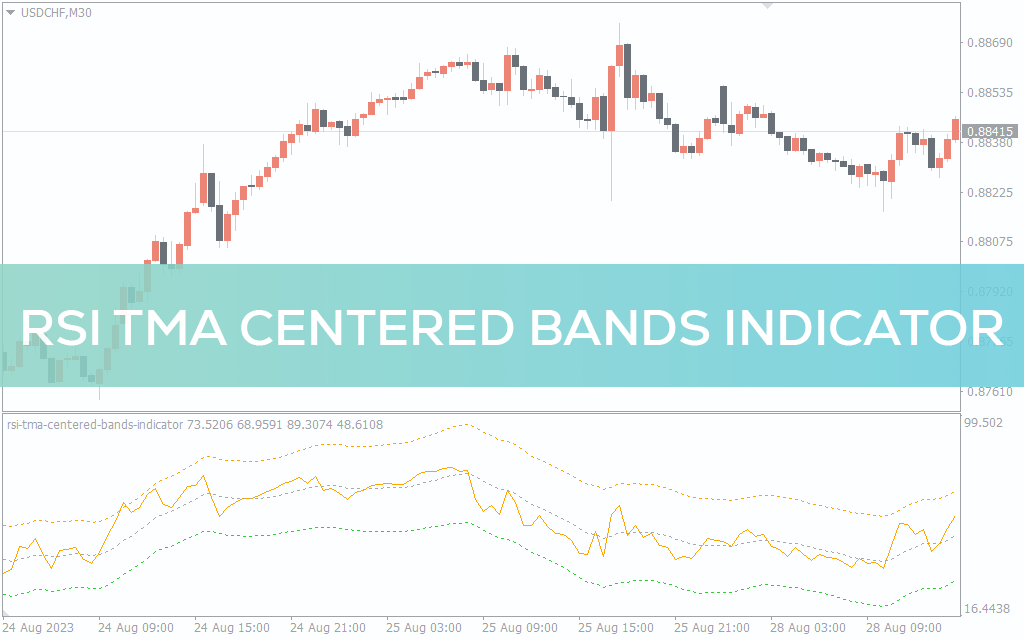
RSI TMA Centered Bands Indicator For MT4 combines both RSI and TMA to provide forex trend direction, entry point, and overbought oversold conditions
Description
The RSI TMA centered bands indicator for MT4 is a combination of the classic RSI and the TMA indicators. The TMA – Triangular moving average is plotted based on the RSI – Relative Strength index. So, the indicator helps forex traders to identify the trend direction, over bought and oversold conditions. As a result, it is possible for traders to enter in the best possible entry point.
The indicator works well in all chart frames, the TMA is plotted around the RSI in the separate indicator window. It is easy to identify and is suitable for new and advanced forex traders.
RSI TMA Centered Bands Indicator For MT4 Trading Signals
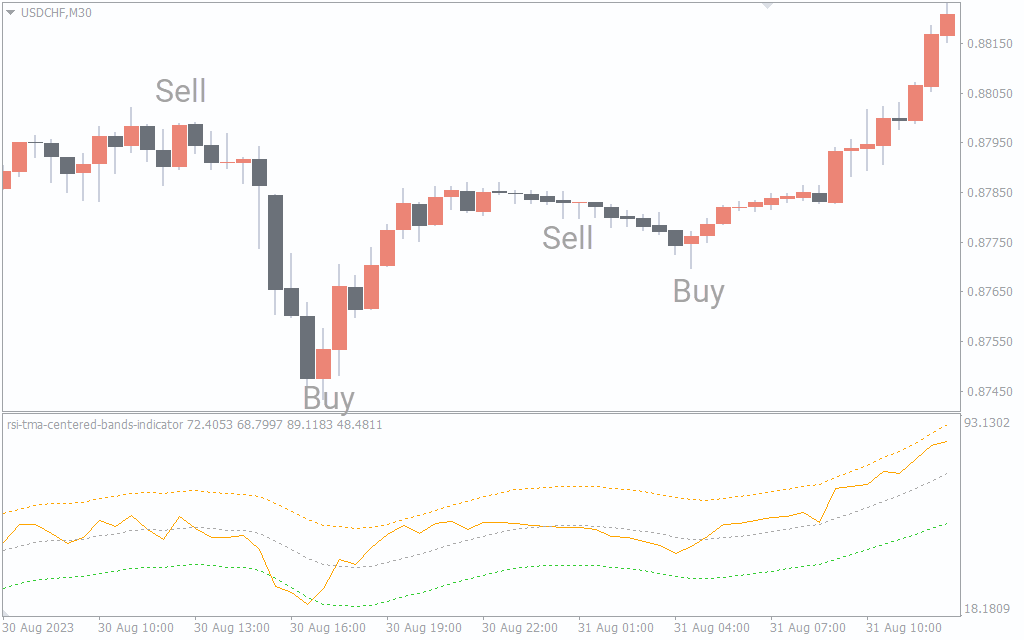
The indicator plots the RSI line as orange. Additionally, the TMA has a orange dotted line as upper band with a grey mid line and green lower band. The trading strategy is based on the crossover of the RSI line and the TMA midline. Additionally, the angle of the TMA bands indicates the trend direction.
If the TMA band angle towards upward direction it indicates a bullish trend. Traders should look for the RSI line to cross upwards the TMA midline and enter the market with a buy trade. The indicator does not provide a profit and stop loss levels. So, traders should place a stop below the previous swing low and book profit with a good risk reward ratio.
On the other hand, if the TMA bands incline downwards and the RSI crosses the TMA midline downwards it is a bearish trading signal.
Conclusion
In summary, the RSI TMA centered bands indicator for MT4 indicates trend with overbought and oversold conditions. Though the indicator provides an entry point it does not provide a stop loss or profit target.