

New Camarilla Pivot Points Indicator
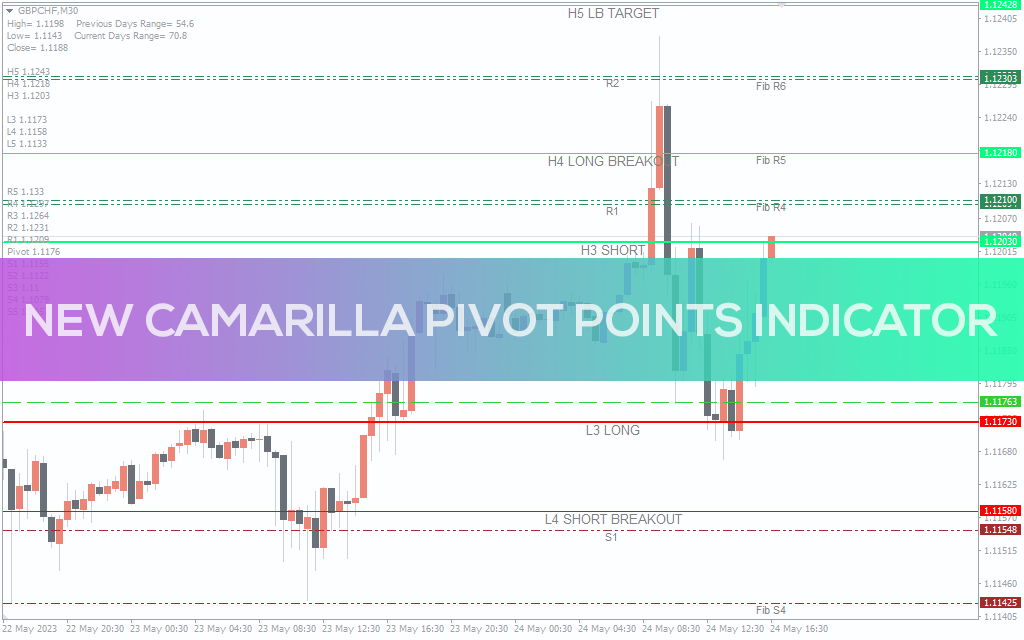
Forex market levels from the best New Camarilla Pivot Points Indicator for MT4. Find multiple support and resistance levels.
Description
The New Camarilla Pivot Points Indicator determines multiple support and resistance levels. It is based on a mathematical formula calculating several pivot points based on the previous trading day’s high, low, and closing prices.
The calculation of New Camarilla Pivot Points involves several levels of support and resistance. These include the central pivot point (PP), support levels below the PP and resistance levels above it.
Fibonacci levels are added to the standard support and resistance levels in this modified version of the Camarilla Pivot. These Fibonacci-based levels can provide insights into potential price reversals or continuations.
How To Use the New Camarilla Pivot Points Indicator for MT4?
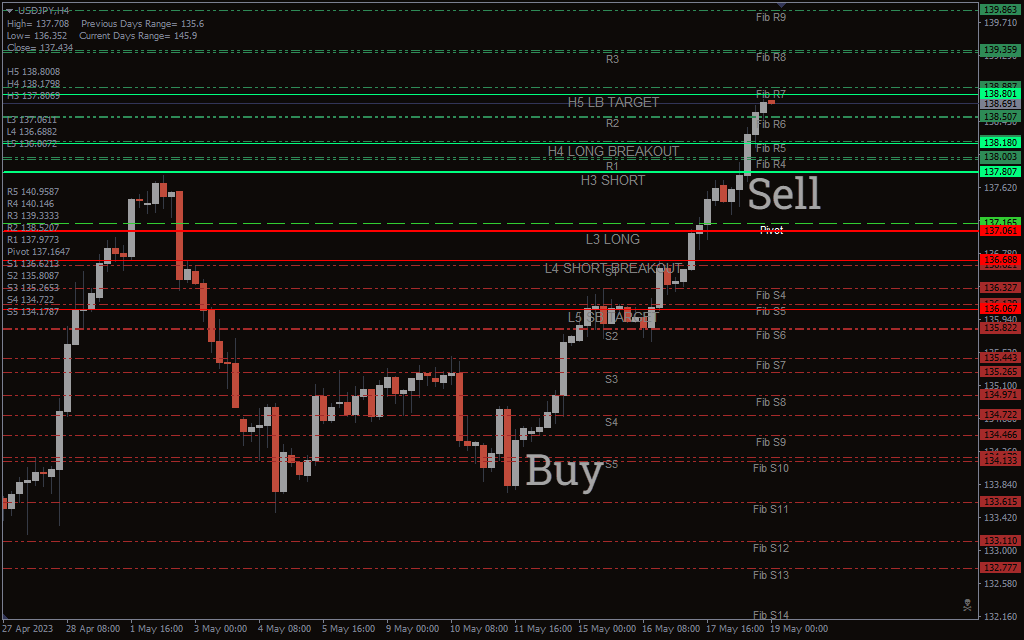
The above USD/JPY H4 chart shows the indicator’s BUY/SELL signals.
When the price breaks above a resistance level, it can be considered a bullish signal. Conversely, if the price breaks below a support level, it can be seen as a bearish signal.
Instead of waiting for a breakout, you can also see if the price bounces off the support or resistance levels. If the price touches a support level and bounces higher, it may indicate a buying opportunity.
Conversely, if the price reaches a resistance level and bounces lower, it may suggest a selling opportunity.
Conclusion
The New Camarilla Pivot Points Indicator for MT4 is a modified version of the traditional Camarilla Pivot. It uses the Fib levels to mark multiple support and resistance levels.